
Page 309 - Enhanced Oil Recovery in Shale and Tight Reservoirs
P. 309
282 Enhanced Oil Recovery in Shale and Tight Reservoirs
Type Imbibition curve Pore distribution Parameters
C
n ~0.5
i
“B”
2 n L > 0
Sqrt (t/L )
50nm
Pore size diameter (nm)
C
n i > 0.5
“S”
n L > 0
2 50nm
Sqrt (t/L )
Pore size diameter (nm)
C
0.26 < n i < 0.5
“A”
n L > 0.1
2 50nm
Sqrt (t/L )
Pore size diameter (nm)
C
From n i > 0.5
to
“M”
0.26 < n i <0.5
2 50nm
Sqrt (t/L ) n L > 0.1
Pore size diameter (nm)
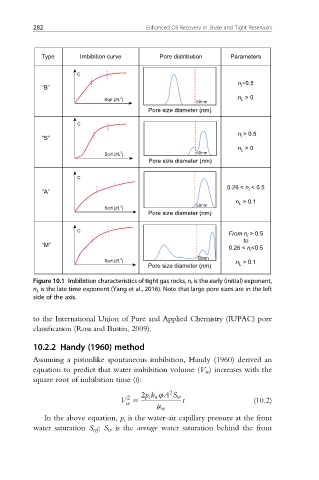
Figure 10.1 Imbibition characteristics of tight gas rocks, n i is the early (initial) exponent,
n L is the late time exponent (Yang et al., 2016). Note that large pore sizes are in the left
side of the axis.
to the International Union of Pure and Applied Chemistry (IUPAC) pore
classification (Ross and Bustin, 2009).
10.2.2 Handy (1960) method
Assuming a pistonlike spontaneous imbibition, Handy (1960) derived an
equation to predict that water imbibition volume (V w ) increases with the
square root of imbibition time (t):
2
2 2p c k w 4A S w
V ¼ t (10.2)
w
m w
In the above equation, p c is the water-air capillary pressure at the front
water saturation S wf ; S w is the average water saturation behind the front