
Page 483 - Enhanced Oil Recovery in Shale and Tight Reservoirs
P. 483
Air injection 447
13.5.7 Experimental
A Berea sandstone core of 5.308 cm length and 3.874 cm diameter was used.
The porosity was 19.01% and the nitrogen permeability was about 200 mD.
This core plug was repeatedly used for tests at different temperatures and for
gas and nitrogen. After each test, the core was cleaned by a Soxhlet extractor
for the next test. Wolfcamp crude oil was used. The density of this crude oil
is 0.83 g/cc (38.98 API) and the viscosity of this crude oil is 3.66 cP at 25 C
and at atmospheric pressure.
The core was saturated by oil and air or nitrogen was injected at 840 psi
at the inlet and the back pressure at the outlet was 800 psi. For both nitrogen
and air injection tests, isothermal tests were conducted under 80, 100, and
120 C, respectively.
13.5.8 Results and discussion
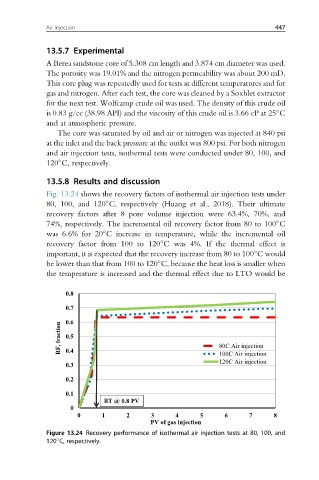
Fig. 13.24 shows the recovery factors of isothermal air injection tests under
80, 100, and 120 C, respectively (Huang et al., 2018). Their ultimate
recovery factors after 8 pore volume injection were 63.4%, 70%, and
74%, respectively. The incremental oil recovery factor from 80 to 100 C
was 6.6% for 20 C increase in temperature, while the incremental oil
recovery factor from 100 to 120 C was 4%. If the thermal effect is
important, it is expected that the recovery increase from 80 to 100 C would
be lower than that from 100 to 120 C, because the heat loss is smaller when
the temperature is increased and the thermal effect due to LTO would be
0.8
0.7
RF, fraction 0.6 80C Air injection
0.5
100C Air injection
0.4
120C Air injection
0.3
0.2
0.1
BT @ 0.8 PV
0
0 1 2 3 4 5 6 7 8
PV of gas injection
Figure 13.24 Recovery performance of isothermal air injection tests at 80, 100, and
120 C, respectively.