
Page 486 - Enhanced Oil Recovery in Shale and Tight Reservoirs
P. 486
450 Enhanced Oil Recovery in Shale and Tight Reservoirs
significant than in a reservoir. Similarly, after 8 PV of air injection, nitrogen
was injected. Fig. 13.26 shows that no more oil was recovered from
additional nitrogen injection (Huang et al., 2018), which is expected. At
120 C, it seems that a little more oil was recovered. This more oil was
probably experimental error.
13.5.9 Numerical analysis
The LTO effect in the above experiments was further analyzed by numerical
simulation. A simulation model was built using the thermal simulator CMG-
STARS. The kinetic data and kinetic model for the Wolfcamp oil in the
LTO stage were obtained and developed in Huang et al. (2016a) and Huang
and Sheng (2017c). 1D Cartesian grids of 5 1 1 were used to represent
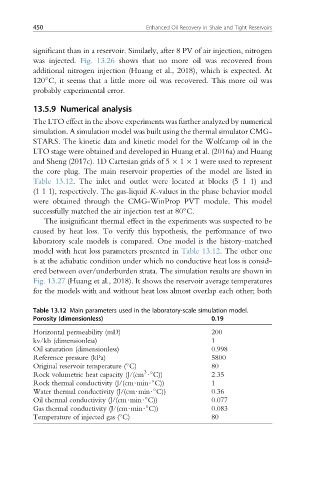
the core plug. The main reservoir properties of the model are listed in
Table 13.12. The inlet and outlet were located at blocks (5 1 1) and
(1 1 1), respectively. The gas-liquid K-values in the phase behavior model
were obtained through the CMG-WinProp PVT module. This model
successfully matched the air injection test at 80 C.
The insignificant thermal effect in the experiments was suspected to be
caused by heat loss. To verify this hypothesis, the performance of two
laboratory scale models is compared. One model is the history-matched
model with heat loss parameters presented in Table 13.12. The other one
is at the adiabatic condition under which no conductive heat loss is consid-
ered between over/underburden strata. The simulation results are shown in
Fig. 13.27 (Huang et al., 2018). It shows the reservoir average temperatures
for the models with and without heat loss almost overlap each other; both
Table 13.12 Main parameters used in the laboratory-scale simulation model.
Porosity (dimensionless) 0.19
Horizontal permeability (mD) 200
kv/kh (dimensionless) 1
Oil saturation (dimensionless) 0.998
Reference pressure (kPa) 5800
Original reservoir temperature ( C) 80
Rock volumetric heat capacity (J/(cm $ C)) 2.35
3
Rock thermal conductivity (J/(cm$min$ C)) 1
Water thermal conductivity (J/(cm$min$ C)) 0.36
Oil thermal conductivity (J/(cm$min$ C)) 0.077
Gas thermal conductivity (J/(cm$min$ C)) 0.083
Temperature of injected gas ( C) 80