
Page 52 - Enhanced Oil Recovery in Shale and Tight Reservoirs
P. 52
40 Enhanced Oil Recovery in Shale and Tight Reservoirs
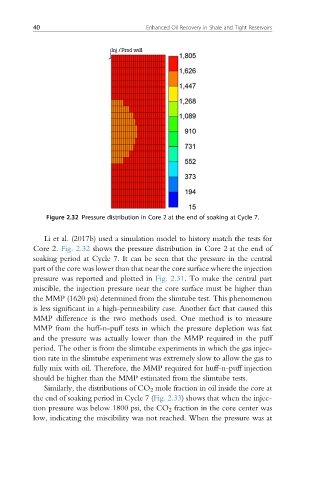
Figure 2.32 Pressure distribution in Core 2 at the end of soaking at Cycle 7.
Li et al. (2017b) used a simulation model to history match the tests for
Core 2. Fig. 2.32 shows the pressure distribution in Core 2 at the end of
soaking period at Cycle 7. It can be seen that the pressure in the central
part of the core was lower than that near the core surface where the injection
pressure was reported and plotted in Fig. 2.31. To make the central part
miscible, the injection pressure near the core surface must be higher than
the MMP (1620 psi) determined from the slimtube test. This phenomenon
is less significant in a high-permeability case. Another fact that caused this
MMP difference is the two methods used. One method is to measure
MMP from the huff-n-puff tests in which the pressure depletion was fast
and the pressure was actually lower than the MMP required in the puff
period. The other is from the slimtube experiments in which the gas injec-
tion rate in the slimtube experiment was extremely slow to allow the gas to
fully mix with oil. Therefore, the MMP required for huff-n-puff injection
should be higher than the MMP estimated from the slimtube tests.
Similarly, the distributions of CO 2 mole fraction in oil inside the core at
the end of soaking period in Cycle 7 (Fig. 2.33) shows that when the injec-
tion pressure was below 1800 psi, the CO 2 fraction in the core center was
low, indicating the miscibility was not reached. When the pressure was at