
Page 55 - Enhanced Oil Recovery in Shale and Tight Reservoirs
P. 55
Huff-n-puff gas injection in oil reservoirs 43
the Sigmund (1976) correlation. Fig. 2.35 shows that the oil recovery with
diffusion is about 10% higher than that without diffusion in the first five
cycles. The difference becomes lower with later cycles.
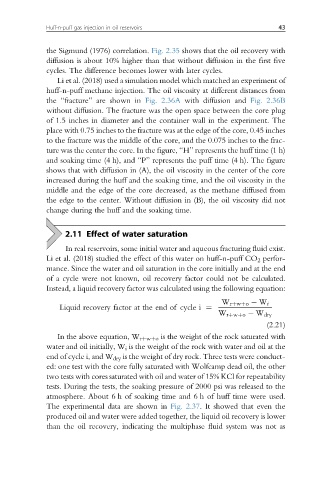
Li et al. (2018) used a simulation model which matched an experiment of
huff-n-puff methane injection. The oil viscosity at different distances from
the “fracture” are shown in Fig. 2.36A with diffusion and Fig. 2.36B
without diffusion. The fracture was the open space between the core plug
of 1.5 inches in diameter and the container wall in the experiment. The
place with 0.75 inches to the fracture was at the edge of the core, 0.45 inches
to the fracture was the middle of the core, and the 0.075 inches to the frac-
ture was the center the core. In the figure, “H” represents the huff time (1 h)
and soaking time (4 h), and “P” represents the puff time (4 h). The figure
shows that with diffusion in (A), the oil viscosity in the center of the core
increased during the huff and the soaking time, and the oil viscosity in the
middle and the edge of the core decreased, as the methane diffused from
the edge to the center. Without diffusion in (B), the oil viscosity did not
change during the huff and the soaking time.
2.11 Effect of water saturation
In real reservoirs, some initial water and aqueous fracturing fluid exist.
Li et al. (2018) studied the effect of this water on huff-n-puff CO 2 perfor-
mance. Since the water and oil saturation in the core initially and at the end
of a cycle were not known, oil recovery factor could not be calculated.
Instead, a liquid recovery factor was calculated using the following equation:
W rþwþo W i
Liquid recovery factor at the end of cycle i ¼
W rþwþo W dry
(2.21)
In the above equation, W rþwþo is the weight of the rock saturated with
water and oil initially, W i is the weight of the rock with water and oil at the
end of cycle i, and W dry is the weight of dry rock. Three tests were conduct-
ed: one test with the core fully saturated with Wolfcamp dead oil, the other
two tests with cores saturated with oil and water of 15% KCl for repeatability
tests. During the tests, the soaking pressure of 2000 psi was released to the
atmosphere. About 6 h of soaking time and 6 h of huff time were used.
The experimental data are shown in Fig. 2.37. It showed that even the
produced oil and water were added together, the liquid oil recovery is lower
than the oil recovery, indicating the multiphase fluid system was not as