
Page 95 - Enhanced Oil Recovery in Shale and Tight Reservoirs
P. 95
82 Enhanced Oil Recovery in Shale and Tight Reservoirs
Pressure path
1
in reservoir
2 Start of condensation
Retrograde gas
Dew-point line
Critical
point
Pressure C 3 Start of vaporization
% Liquid
Dew-point line 40 30 20 15 4
10
Two-Phase Region
G Separator 5
0
5
Temperature
Completion of vaporization
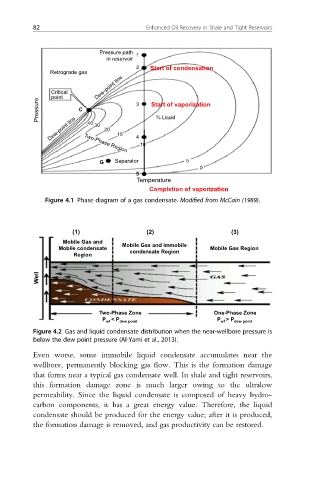
Figure 4.1 Phase diagram of a gas condensate. Modified from McCain (1989).
(1) (2) (3)
Mobile Gas and Mobile Gas and immobile
Mobile condensate condensate Region Mobile Gas Region
Region
Well
Two-Phase Zone One-Phase Zone
P < P dew point P > P dew point
wf
wf
Figure 4.2 Gas and liquid condensate distribution when the near-wellbore pressure is
below the dew point pressure (Al-Yami et al., 2013).
Even worse, some immobile liquid condensate accumulates near the
wellbore, permanently blocking gas flow. This is the formation damage
that forms near a typical gas condensate well. In shale and tight reservoirs,
this formation damage zone is much larger owing to the ultralow
permeability. Since the liquid condensate is composed of heavy hydro-
carbon components, it has a great energy value. Therefore, the liquid
condensate should be produced for the energy value; after it is produced,
the formation damage is removed, and gas productivity can be restored.