
Page 98 - Enhanced Oil Recovery in Shale and Tight Reservoirs
P. 98
Huff-n-puff injection in shale gas condensate reservoirs 85
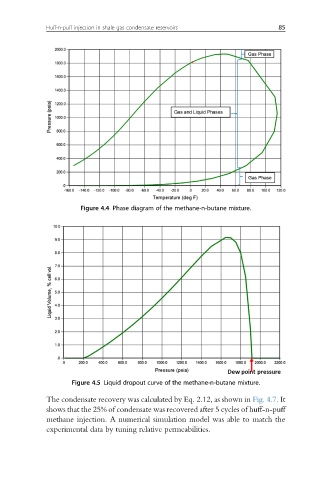
Figure 4.4 Phase diagram of the methane-n-butane mixture.
Figure 4.5 Liquid dropout curve of the methane-n-butane mixture.
The condensate recovery was calculated by Eq. 2.12, as shown in Fig. 4.7.It
shows that the 25% of condensate was recovered after 5 cycles of huff-n-puff
methane injection. A numerical simulation model was able to match the
experimental data by tuning relative permeabilities.