
Page 102 - Enhanced Oil Recovery in Shale and Tight Reservoirs
P. 102
Huff-n-puff injection in shale gas condensate reservoirs 89
Table 4.1 Performance comparison of different scenarios (100 nD).
Primary Gas flooding (A) Huff-n-puff (B) Ratio (B/A)
Total gas produced 357.01 275.43 3133.7 11.38
(MMSCF)
Gas injected (MMSCF) 0 216.36 3008.3 13.90
Net gas produced 357.01 59.07 125.4 2.12
(MMSCF)
Oil produced (MSTB) 30.385 36.5 46.666 1.28
Oil recovery factor (%) 26 31.23 39.93 1.28
Value of produced oil 4.46654 3.88628 5.1682 1.33
and gas (MM$)
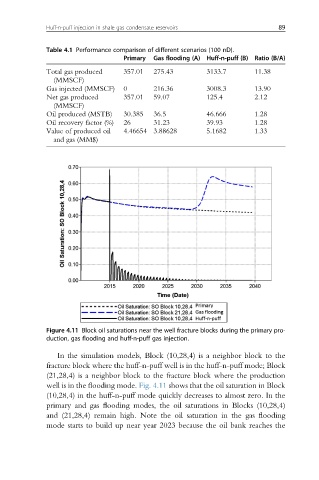
Figure 4.11 Block oil saturations near the well fracture blocks during the primary pro-
duction, gas flooding and huff-n-puff gas injection.
In the simulation models, Block (10,28,4) is a neighbor block to the
fracture block where the huff-n-puff well is in the huff-n-puff mode; Block
(21,28,4) is a neighbor block to the fracture block where the production
well is in the flooding mode. Fig. 4.11 shows that the oil saturation in Block
(10,28,4) in the huff-n-puff mode quickly decreases to almost zero. In the
primary and gas flooding modes, the oil saturations in Blocks (10,28,4)
and (21,28,4) remain high. Note the oil saturation in the gas flooding
mode starts to build up near year 2023 because the oil bank reaches the