
Page 106 - Enhanced Oil Recovery in Shale and Tight Reservoirs
P. 106
Huff-n-puff injection in shale gas condensate reservoirs 93
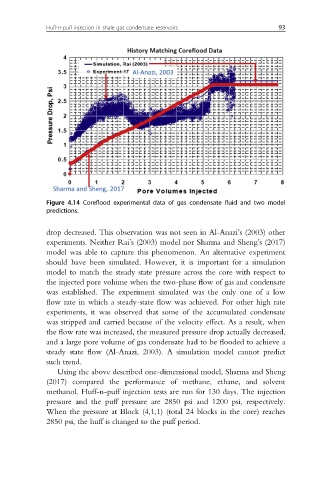
Figure 4.14 Coreflood experimental data of gas condensate fluid and two model
predictions.
drop decreased. This observation was not seen in Al-Anazi’s (2003) other
experiments. Neither Rai’s (2003) model nor Sharma and Sheng’s (2017)
model was able to capture this phenomenon. An alternative experiment
should have been simulated. However, it is important for a simulation
model to match the steady state pressure across the core with respect to
the injected pore volume when the two-phase flow of gas and condensate
was established. The experiment simulated was the only one of a low
flow rate in which a steady-state flow was achieved. For other high rate
experiments, it was observed that some of the accumulated condensate
was stripped and carried because of the velocity effect. As a result, when
the flow rate was increased, the measured pressure drop actually decreased,
and a large pore volume of gas condensate had to be flooded to achieve a
steady state flow (Al-Anazi, 2003). A simulation model cannot predict
such trend.
Using the above described one-dimensional model, Sharma and Sheng
(2017) compared the performance of methane, ethane, and solvent
methanol. Huff-n-puff injection tests are run for 130 days. The injection
pressure and the puff pressure are 2850 psi and 1200 psi, respectively.
When the pressure at Block (4,1,1) (total 24 blocks in the core) reaches
2850 psi, the huff is changed to the puff period.