
Page 105 - Enhanced Oil Recovery in Shale and Tight Reservoirs
P. 105
92 Enhanced Oil Recovery in Shale and Tight Reservoirs
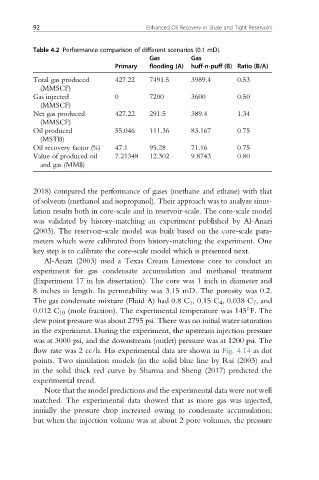
Table 4.2 Performance comparison of different scenarios (0.1 mD).
Gas Gas
Primary flooding (A) huff-n-puff (B) Ratio (B/A)
Total gas produced 427.22 7491.5 3989.4 0.53
(MMSCF)
Gas injected 0 7200 3600 0.50
(MMSCF)
Net gas produced 427.22 291.5 389.4 1.34
(MMSCF)
Oil produced 55.046 111.36 83.167 0.75
(MSTB)
Oil recovery factor (%) 47.1 95.28 71.16 0.75
Value of produced oil 7.21348 12.302 9.8743 0.80
and gas (MM$)
2018) compared the performance of gases (methane and ethane) with that
of solvents (methanol and isopropanol). Their approach was to analyze simu-
lation results both in core-scale and in reservoir-scale. The core-scale model
was validated by history-matching an experiment published by Al-Anazi
(2003). The reservoir-scale model was built based on the core-scale para-
meters which were calibrated from history-matching the experiment. One
key step is to calibrate the core-scale model which is presented next.
Al-Anazi (2003) used a Texas Cream Limestone core to conduct an
experiment for gas condensate accumulation and methanol treatment
(Experiment 17 in his dissertation). The core was 1 inch in diameter and
8 inches in length. Its permeability was 3.15 mD. The porosity was 0.2.
The gas condensate mixture (Fluid A) had 0.8 C 1 , 0.15 C 4 , 0.038 C 7 , and
0.012 C 10 (mole fraction). The experimental temperature was 145 F. The
dew point pressure was about 2795 psi. There was no initial water saturation
in the experiment. During the experiment, the upstream injection pressure
was at 3000 psi, and the downstream (outlet) pressure was at 1200 psi. The
flow rate was 2 cc/h. His experimental data are shown in Fig. 4.14 as dot
points. Two simulation models (in the solid blue line by Rai (2003) and
in the solid thick red curve by Sharma and Sheng (2017) predicted the
experimental trend.
Note that the model predictions and the experimental data were not well
matched. The experimental data showed that as more gas was injected,
initially the pressure drop increased owing to condensate accumulation;
but when the injection volume was at about 2 pore volumes, the pressure