
Page 77 - Environmental Control in Petroleum Engineering
P. 77
64 Environmental Control in Petroleum Engineering
(text continued from page 61)
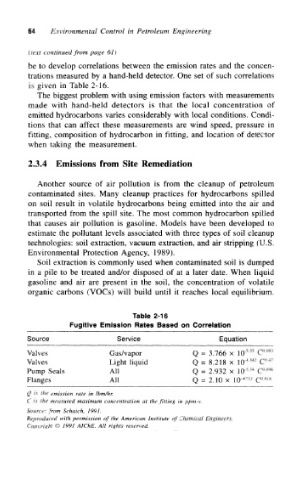
be to develop correlations between the emission rates and the concen-
trations measured by a hand-held detector. One set of such correlations
is given in Table 2-16.
The biggest problem with using emission factors with measurements
made with hand-held detectors is that the local concentration of
emitted hydrocarbons varies considerably with local conditions. Condi-
tions that can affect these measurements are wind speed, pressure in
fitting, composition of hydrocarbon in fitting, and location of detector
when taking the measurement.
2.3.4 Emissions from Site Remediation
Another source of air pollution is from the cleanup of petroleum
contaminated sites. Many cleanup practices for hydrocarbons spilled
on soil result in volatile hydrocarbons being emitted into the air and
transported from the spill site. The most common hydrocarbon spilled
that causes air pollution is gasoline. Models have been developed to
estimate the pollutant levels associated with three types of soil cleanup
technologies: soil extraction, vacuum extraction, and air stripping (U.S.
Environmental Protection Agency, 1989).
Soil extraction is commonly used when contaminated soil is dumped
in a pile to be treated and/or disposed of at a later date. When liquid
gasoline and air are present in the soil, the concentration of volatile
organic carbons (VOCs) will build until it reaches local equilibrium.
Table 2-16
Fugitive Emission Rates Based on Correlation
Source Service Equation
535
Valves Gas/vapor Q = 3.766 x 10~ C 0693
Valves Light liquid Q = 8.218 x lO^ 4342 C 047
5 34
Pump Seals All Q = 2.932 x 1Q- - C 0898
Flanges All Q = 2.10 x 10 4733 C 0.818
Q is the emission rate in Ibm/hr.
C is the measured maximum concentration at the fitting in ppm-v,
Source: from Schaich, 1991.
Reproduced with permission of the American Institute of Chemical Engineers.
Copyright © 1991 AlChE. All rights reserved.