
Page 367 - Environmental Nanotechnology Applications and Impacts of Nanomaterials
P. 367
352 Environmental Applications of Nanomaterials
should be higher for these species in comparison with larger colloidal
species, if there is no resistant cake deposited on the membrane.
However, if a layer of nanoparticles deposits on the membrane, this
may lead to a decrease in flux due to membrane fouling.
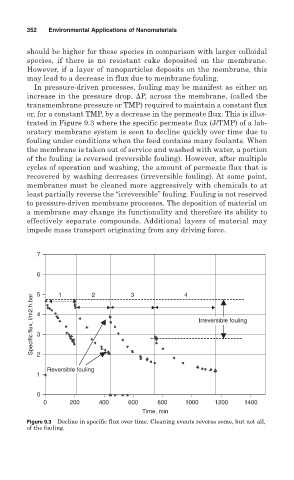
In pressure-driven processes, fouling may be manifest as either an
increase in the pressure drop, P, across the membrane, (called the
transmembrane pressure or TMP) required to maintain a constant flux
or, for a constant TMP, by a decrease in the permeate flux. This is illus-
trated in Figure 9.3 where the specific permeate flux (J/TMP) of a lab-
oratory membrane system is seen to decline quickly over time due to
fouling under conditions when the feed contains many foulants. When
the membrane is taken out of service and washed with water, a portion
of the fouling is reversed (reversible fouling). However, after multiple
cycles of operation and washing, the amount of permeate flux that is
recovered by washing decreases (irreversible fouling). At some point,
membranes must be cleaned more aggressively with chemicals to at
least partially reverse the “irreversible” fouling. Fouling is not reserved
to pressure-driven membrane processes. The deposition of material on
a membrane may change its functionality and therefore its ability to
effectively separate compounds. Additional layers of material may
impede mass transport originating from any driving force.
7
6 5 1 2 3 4
Specific flux, l/m2.h.bar 4 3 Irreversible fouling
2
Reversible fouling
1
0
0 200 400 600 800 1000 1200 1400
Time, min
Figure 9.3 Decline in specific flux over time. Cleaning events reverse some, but not all,
of the fouling.