
Page 185 - Essentials of physical chemistry
P. 185
Basic Chemical Kinetics 147
Arrhenius rate plot
0
0.0031 0.0032 0.0033 0.0034 0.0035 0.0036 0.0037
–2
–4
–6
ln k
–8
–10
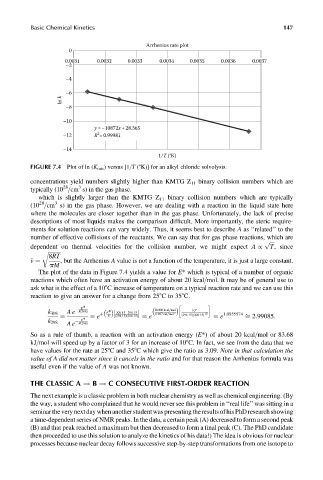
y =–10872x+28.365
2
–12 R =0.99981
–14
1/T (°K)
FIGURE 7.4 Plot of ln (K rate ) versus [1=T (8K)] for an alkyl chloride solvolysis.
concentrations yield numbers slightly higher than KMTG Z 11 binary collision numbers which are
3
28
typically (10 =cm s) in the gas phase.
which is slightly larger than the KMTG Z 11 binary collision numbers which are typically
28
3
(10 =cm s) in the gas phase. However, we are dealing with a reaction in the liquid state here
where the molecules are closer together than in the gas phase. Unfortunately, the lack of precise
descriptions of most liquids makes the comparison difficult. More importantly, the steric require-
ments for solution reactions can vary widely. Thus, it seems best to describe A as ‘‘related’’ to the
number of effective collisions of the reactants. We can say that for gas phase reactions, which are
ffiffiffiffi
p
T, since
dependent on thermal velocities for the collision number, we might expect A /
r ffiffiffiffiffiffiffiffiffi
8RT
, but the Arrhenius A value is not a function of the temperature, it is just a large constant.
pM
v ¼
The plot of the data in Figure 7.4 yields a value for E* which is typical of a number of organic
reactions which often have an activation energy of about 20 kcal=mol. It may be of general use to
ask what is the effect of a 108C increase of temperature on a typical reaction rate and we can use this
reaction to give an answer for a change from 258Cto358C.
h i
E*
Ae R(308) E* 20000 kcal=mol 10
k 308 308:15 298:15 1:987 cal=mol 8 (298:15)(308:15) 8 2 1:0955574
¼ e þ R ½ (298:15)(308:15) ¼ e ¼ e ffi 2:99085:
E*
¼
k 298
Ae R(298)
So as a rule of thumb, a reaction with an activation energy (E*) of about 20 kcal=mol or 83.68
kJ=mol will speed up by a factor of 3 for an increase of 108C. In fact, we see from the data that we
have values for the rate at 258C and 358C which give the ratio as 3.09. Note in that calculation the
value of A did not matter since it cancels in the ratio and for that reason the Arrhenius formula was
useful even if the value of A was not known.
THE CLASSIC A ! B ! C CONSECUTIVE FIRST-ORDER REACTION
The next example is a classic problem in both nuclear chemistry as well as chemical engineering. (By
the way, a student who complained that he would never see this problem in ‘‘real life’’ was sitting in a
seminar the very next day when another student was presenting the results of his PhD research showing
a time-dependent series of NMR peaks. In the data, a certain peak (A) decreased to form a second peak
(B) and that peak reached a maximum but then decreased to form a final peak (C). The PhD candidate
then proceeded to use this solution to analyze the kinetics of his data!) The idea is obvious for nuclear
processes because nuclear decay follows successive step-by-step transformations from one isotope to