
Page 146 - Excel 2007 Bible
P. 146
10_044039 ch06.qxp 11/21/06 10:57 AM Page 103
n StdDev: Displays the standard deviation of the values in the column. Standard deviation is a sta-
n Var: Displays the variance of the values in the column. Variance is another statistical measure of
how “spread out” the values are.
n More Functions: Displays the Insert Function dialog box so that you can select a function that
isn’t in the list.
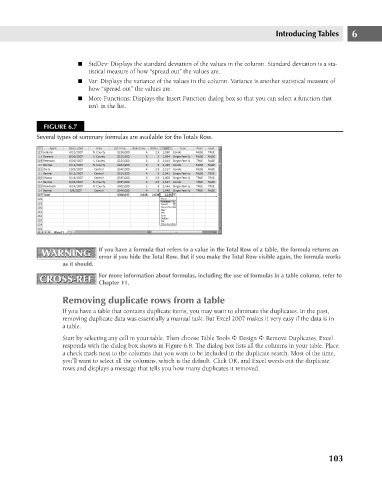
FIGURE 6.7
Several types of summary formulas are available for the Totals Row.
If you have a formula that refers to a value in the Total Row of a table, the formula returns an
WARNING tistical measure of how “spread out” the values are. Introducing Tables 6
WARNING
error if you hide the Total Row. But if you make the Total Row visible again, the formula works
as it should.
CROSS-REF For more information about formulas, including the use of formulas in a table column, refer to
CROSS-REF
Chapter 11.
Removing duplicate rows from a table
If you have a table that contains duplicate items, you may want to eliminate the duplicates. In the past,
removing duplicate data was essentially a manual task. But Excel 2007 makes it very easy if the data is in
a table.
Start by selecting any cell in your table. Then choose Table Tools ➪ Design ➪ Remove Duplicates. Excel
responds with the dialog box shown in Figure 6.8. The dialog box lists all the columns in your table. Place
a check mark next to the columns that you want to be included in the duplicate search. Most of the time,
you’ll want to select all the columns, which is the default. Click OK, and Excel weeds out the duplicate
rows and displays a message that tells you how many duplicates it removed.
103