Page 342 - Excel 2007 Bible
P. 342

21_044039 ch16.qxp  11/21/06  11:07 AM  Page 299
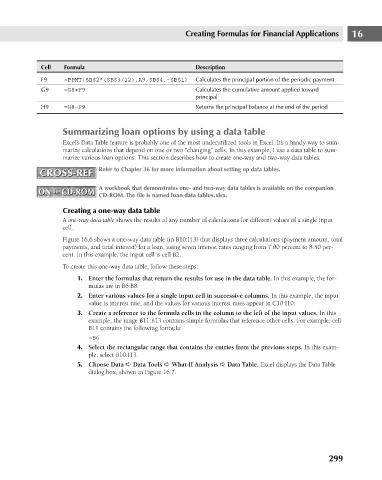
                                             Formula
                                       Cell
                                                                                 Description
                                       F9
                                                                                 Calculates the principal portion of the periodic payment
                                             =PPMT($B$2*($B$3/12),A9,$B$4,-$B$1)
                                       G9
                                                                                 Calculates the cumulative amount applied toward
                                             =G8+F9
                                                                                 principal
                                       H9
                                                                                 Returns the principal balance at the end of the period
                                             =H8-F9
                                             Summarizing loan options by using a data table
                                             Excel’s Data Table feature is probably one of the most underutilized tools in Excel. It’s a handy way to sum-
                                             marize calculations that depend on one or two “changing” cells. In this example, I use a data table to sum-
                                             marize various loan options. This section describes how to create one-way and two-way data tables.
                                                       Refer to Chapter 36 for more information about setting up data tables.
                                      CROSS-REF
                                      CROSS-REF
                                                       A workbook that demonstrates one- and two-way data tables is available on the companion
                                      ON  the  CD-ROM
                                      ON  the  CD-ROM
                                                       CD-ROM. The file is named loan data tables.xlsx.
                                             Creating a one-way data table     Creating Formulas for Financial Applications  16
                                             A one-way data table shows the results of any number of calculations for different values of a single input
                                             cell.
                                             Figure 16.6 shows a one-way data table (in B10:I13) that displays three calculations (payment amount, total
                                             payments, and total interest) for a loan, using seven interest rates ranging from 7.00 percent to 8.50 per-
                                             cent. In this example, the input cell is cell B2.
                                             To create this one-way data table, follow these steps:
                                                 1. Enter the formulas that return the results for use in the data table. In this example, the for-
                                                    mulas are in B6:B8.
                                                 2. Enter various values for a single input cell in successive columns. In this example, the input
                                                    value is interest rate, and the values for various interest rates appear in C10:I10.
                                                 3. Create a reference to the formula cells in the column to the left of the input values. In this
                                                    example, the range B11:B13 contains simple formulas that reference other cells. For example, cell
                                                    B11 contains the following formula:
                                                    =B6
                                                 4. Select the rectangular range that contains the entries from the previous steps. In this exam-
                                                    ple, select B10:I13.
                                                 5. Choose Data ➪ Data Tools ➪ What-If Analysis ➪ Data Table. Excel displays the Data Table
                                                    dialog box, shown in Figure 16.7.
                                                                                                                      299
   337   338   339   340   341   342   343   344   345   346   347