
Page 354 - Excel 2007 Bible
P. 354
21_044039 ch16.qxp 11/21/06 11:07 AM Page 311
Creating Formulas for Financial Applications
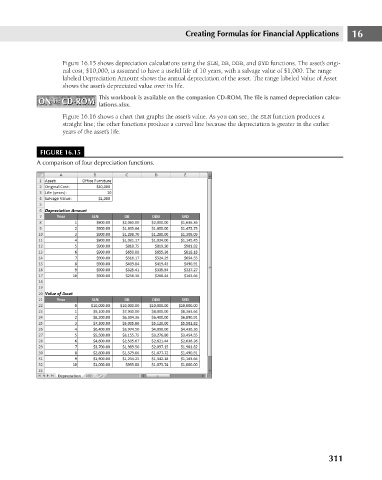
Figure 16.15 shows depreciation calculations using the SLN, DB, DDB, and SYD functions. The asset’s origi-
nal cost, $10,000, is assumed to have a useful life of 10 years, with a salvage value of $1,000. The range
labeled Depreciation Amount shows the annual depreciation of the asset. The range labeled Value of Asset
shows the asset’s depreciated value over its life.
This workbook is available on the companion CD-ROM. The file is named depreciation calcu-
ON the CD-ROM
ON the CD-ROM
lations.xlsx.
Figure 16.16 shows a chart that graphs the asset’s value. As you can see, the SLN function produces a
straight line; the other functions produce a curved line because the depreciation is greater in the earlier
years of the asset’s life.
FIGURE 16.15
A comparison of four depreciation functions.
311 16