
Page 355 - Excel 2007 Bible
P. 355
21_044039 ch16.qxp 11/21/06 11:07 AM Page 312
Part II
Working with Formulas and Functions
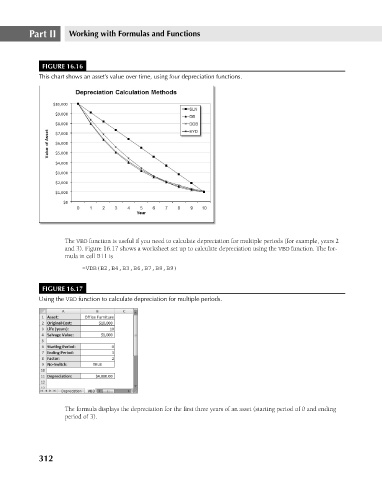
FIGURE 16.16
This chart shows an asset’s value over time, using four depreciation functions.
The VBD function is useful if you need to calculate depreciation for multiple periods (for example, years 2
and 3). Figure 16.17 shows a worksheet set up to calculate depreciation using the VBD function. The for-
mula in cell B11 is
=VDB(B2,B4,B3,B6,B7,B8,B9)
FIGURE 16.17
Using the VBD function to calculate depreciation for multiple periods.
The formula displays the depreciation for the first three years of an asset (starting period of 0 and ending
period of 3).
312