
Page 395 - Excel 2007 Bible
P. 395
25_044039 ch19.qxp 11/21/06 11:10 AM Page 352
Part III
Creating Charts and Graphics
arrive at this same conclusion simply by studying the numbers. But viewing the chart makes the point
much more quickly.
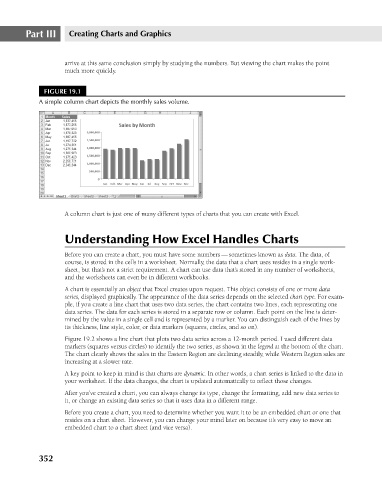
FIGURE 19.1
A simple column chart depicts the monthly sales volume.
A column chart is just one of many different types of charts that you can create with Excel.
Understanding How Excel Handles Charts
Before you can create a chart, you must have some numbers — sometimes known as data. The data, of
course, is stored in the cells in a worksheet. Normally, the data that a chart uses resides in a single work-
sheet, but that’s not a strict requirement. A chart can use data that’s stored in any number of worksheets,
and the worksheets can even be in different workbooks.
A chart is essentially an object that Excel creates upon request. This object consists of one or more data
series, displayed graphically. The appearance of the data series depends on the selected chart type. For exam-
ple, if you create a line chart that uses two data series, the chart contains two lines, each representing one
data series. The data for each series is stored in a separate row or column. Each point on the line is deter-
mined by the value in a single cell and is represented by a marker. You can distinguish each of the lines by
its thickness, line style, color, or data markers (squares, circles, and so on).
Figure 19.2 shows a line chart that plots two data series across a 12-month period. I used different data
markers (squares versus circles) to identify the two series, as shown in the legend at the bottom of the chart.
The chart clearly shows the sales in the Eastern Region are declining steadily, while Western Region sales are
increasing at a slower rate.
A key point to keep in mind is that charts are dynamic. In other words, a chart series is linked to the data in
your worksheet. If the data changes, the chart is updated automatically to reflect those changes.
After you’ve created a chart, you can always change its type, change the formatting, add new data series to
it, or change an existing data series so that it uses data in a different range.
Before you create a chart, you need to determine whether you want it to be an embedded chart or one that
resides on a chart sheet. However, you can change your mind later on because it’s very easy to move an
embedded chart to a chart sheet (and vice versa).
352