
Page 149 - Excel Data Analysis
P. 149
08 537547 Ch07.qxd 3/4/03 12:07 PM Page 135
WORKING WITH PIVOTTABLE REPORTS 7
When there are two or more Data area fields, Excel creates a Excel allows you to change the
separate Data field in the Row area. Excel places the new field on order of the information on a
a separate row below each instance of the first field's data values. PivotTable report by using the Sort
Excel allows you to place a maximum of 256 fields within the Data option that displays when you click
area. Because you can add multiple fields to the Data area, as Data ➪ Sort. You can sort a
with other areas of the PivotTable, you can change the analysis by PivotTable report by any field. See
using filtering to hide some of the Data area calculations. See the Chapter 2 for more information on
section "Filter a Field" for more information on selecting fields. sorting.
This process allows you to create one PivotTable containing all of
your different calculations, but use filtering to only display the
values relevant to the viewers. For example, an individual sales
person may be interested in seeing how their sales total relates to
the overall percentage of sales.
Sum
Month
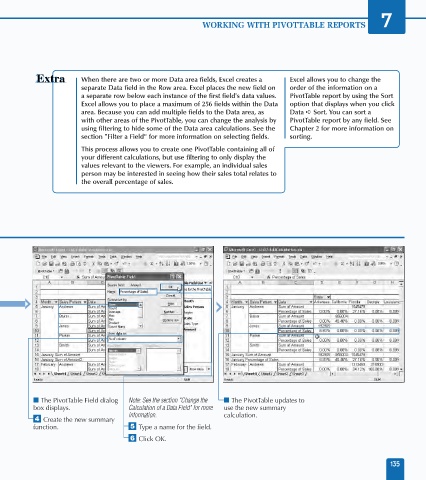
■ The PivotTable Field dialog Note: See the section "Change the ■ The PivotTable updates to
box displays. Calculation of a Data Field" for more use the new summary
information. calculation.
› Create the new summary
function. ˇ Type a name for the field.
Á Click OK.
135