
Page 54 - Excel Data Analysis
P. 54
03 537547 Ch02.qxd 3/4/03 11:47 AM Page 40
EXCEL DATA ANALYSIS
OUTLINE YOUR DATA
ou can create an outline of your data in Excel to The automatic outline feature typically works best when
group common information together in sections. The you have total and subtotal rows and columns. See Chapter
Y feature allows you to expand and collapse individual 3 for information on subtotaling. You select at least one cell
sections, which is handy to an analyst who has long in the range you want to outline and activate the Auto
worksheets of data and must find certain parts of the Outline command. Excel examines the contents of the
worksheet quickly. For example, if you have sales by region worksheet and creates an outline based on the formulas
on one worksheet with each month totaled, you can that you have applied to the worksheet. For example, if
collapse the regional records and view only the total sales your worksheet has a total row, Excel treats that as the
amounts for each month. summary data, or top level. If you have subtotals, Excel
groups them with the corresponding data records.
You can either create a manual outline by identifying each
group of related data records, or you can have Excel create You can use the outline symbols to hide and show the
an automatic outline. You manually outline by first selecting detail records in your worksheet. The minus sign hides the
the rows or columns you want to group. When you activate corresponding rows or columns, while the plus sign
the Group command, Excel places all the rows or columns expands your records. Excel uses numbers to identify the
you select in a section. If you have a specific row or column different summary levels. The first level collapses everything
that you want visible when you collapse the group, you and shows only the summary records.
simply do not make it part of the selection range.
OUTLINE YOUR DATA
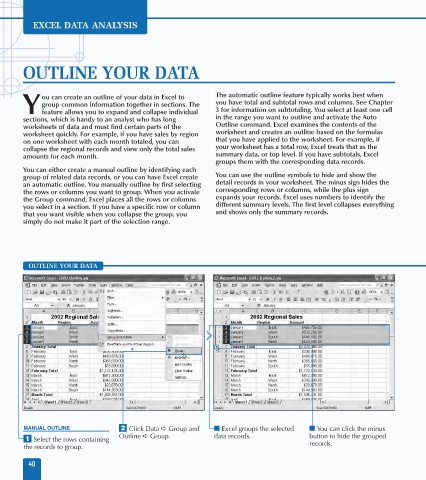
MANUAL OUTLINE ¤ Click Data ➪ Group and ■ Excel groups the selected ■ You can click the minus
Outline ➪ Group. data records. button to hide the grouped
⁄ Select the rows containing
the records to group. records.
40