
Page 252 - Excel Workbook for Dummies
P. 252
26_798452 ch18.qxp 3/13/06 7:45 PM Page 235
Chapter 18: Performing What-If Analysis 235
the original value you want substituted in the master formula in cell B4, you
need to enter this cell reference in this text box.
10. Position the cell pointer in the Column Input Cell text box in the Table dialog
box, and then select the Growth_Rate cell, B3, in the worksheet before you
select OK.
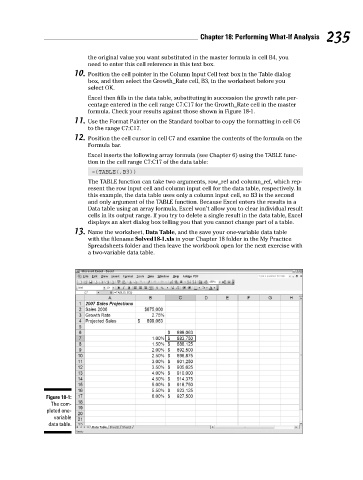
Excel then fills in the data table, substituting in succession the growth rate per-
centage entered in the cell range C7:C17 for the Growth_Rate cell in the master
formula. Check your results against those shown in Figure 18-1.
11. Use the Format Painter on the Standard toolbar to copy the formatting in cell C6
to the range C7:C17.
12. Position the cell cursor in cell C7 and examine the contents of the formula on the
Formula bar.
Excel inserts the following array formula (see Chapter 6) using the TABLE func-
tion in the cell range C7:C17 of the data table:
={TABLE(,B3)}
The TABLE function can take two arguments, row_ref and column_ref, which rep-
resent the row input cell and column input cell for the data table, respectively. In
this example, the data table uses only a column input cell, so B3 is the second
and only argument of the TABLE function. Because Excel enters the results in a
Data table using an array formula, Excel won’t allow you to clear individual result
cells in its output range. If you try to delete a single result in the data table, Excel
displays an alert dialog box telling you that you cannot change part of a table.
13. Name the worksheet, Data Table, and the save your one-variable data table
with the filename Solved18-1.xls in your Chapter 18 folder in the My Practice
Spreadsheets folder and then leave the workbook open for the next exercise with
a two-variable data table.
Figure 18-1:
The com-
pleted one-
variable
data table.