
Page 256 - Excel Workbook for Dummies
P. 256
26_798452 ch18.qxp 3/13/06 7:45 PM Page 239
Chapter 18: Performing What-If Analysis 239
8. Add a third scenario named Best Case with the following changing values:
• 0.1 in Sales_Growth
• 0.05 in COGS
• 0.1 in Expenses
9. With Best Case selected in the Scenario Manager dialog box, select the Show button.
As soon as you select Show, Excel plugs the Best Case scenario’s values into the
changing cells in the Sales Forecast for 2007 table.
10. Take a look at the Worst Case scenario in the Sales Forecast table by double-
clicking Worst Case in the Scenarios list box of the Scenario Manager dialog box.
11. Display the Most Likely scenario in the Sales Forecast table and then close the
Scenario Manager dialog box.
12. Enter the following values in the designated changing cells in the Sales Forecast
for 2007 table:
• 17% in the Sales_Growth cell, H4
• 25% in the COGS cell, H5
• 18% in the Expenses cell, H7
13. Reopen the Scenario Manager dialog box and then click the Summary button
near the bottom of the Scenario Manager dialog box to open the Scenario
Summary dialog box.
14. Select the cell range B8:G8 in the worksheet table to insert the cell range
=$B$8:$G$8 in the Results Cells text box before you select OK.
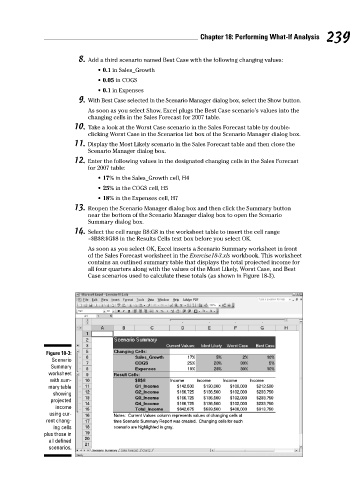
As soon as you select OK, Excel inserts a Scenario Summary worksheet in front
of the Sales Forecast worksheet in the Exercise18-3.xls workbook. This worksheet
contains an outlined summary table that displays the total projected income for
all four quarters along with the values of the Most Likely, Worst Case, and Best
Case scenarios used to calculate these totals (as shown in Figure 18-3).
Figure 18-3:
Scenario
Summary
worksheet
with sum-
mary table
showing
projected
income
using cur-
rent chang-
ing cells
plus those in
all defined
scenarios.