
Page 272 - Excel Workbook for Dummies
P. 272
27_798452 ch19.qxp 3/13/06 7:42 PM Page 255
Chapter 19: Generating Pivot Tables 255
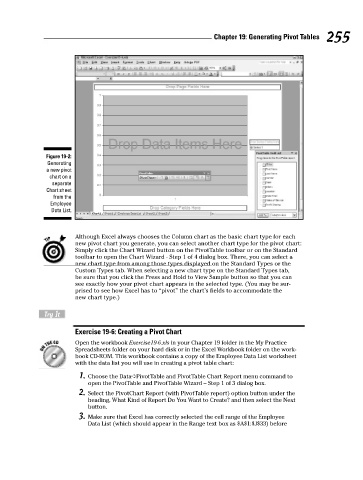
Figure 19-2:
Generating
a new pivot
chart on a
separate
Chart sheet
from the
Employee
Data List.
Although Excel always chooses the Column chart as the basic chart type for each
new pivot chart you generate, you can select another chart type for the pivot chart:
Simply click the Chart Wizard button on the PivotTable toolbar or on the Standard
toolbar to open the Chart Wizard - Step 1 of 4 dialog box. There, you can select a
new chart type from among those types displayed on the Standard Types or the
Custom Types tab. When selecting a new chart type on the Standard Types tab,
be sure that you click the Press and Hold to View Sample button so that you can
see exactly how your pivot chart appears in the selected type. (You may be sur-
prised to see how Excel has to “pivot” the chart’s fields to accommodate the
new chart type.)
Try It
Exercise 19-6: Creating a Pivot Chart
Open the workbook Exercise19-6.xls in your Chapter 19 folder in the My Practice
Spreadsheets folder on your hard disk or in the Excel Workbook folder on the work-
book CD-ROM. This workbook contains a copy of the Employee Data List worksheet
with the data list you will use in creating a pivot table chart:
1. Choose the Data➪PivotTable and PivotTable Chart Report menu command to
open the PivotTable and PivotTable Wizard – Step 1 of 3 dialog box.
2. Select the PivotChart Report (with PivotTable report) option button under the
heading, What Kind of Report Do You Want to Create? and then select the Next
button.
3. Make sure that Excel has correctly selected the cell range of the Employee
Data List (which should appear in the Range text box as $A$1:$J$33) before