
Page 123 - Excel for Scientists and Engineers: Numerical Methods
P. 123
100 EXCEL: NUMERICAL METHODS
Calculation of the first or second derivative of a data set tends to emphasize
the llnoise" in the data set; that is, small errors in the measurements become
relatively much more important. The central difference formula tends to reduce
noise resulting from experimental error.
Points on a curve of x, y values for which the first derivative is a maximum, a
minimum, or zero are often of particular importance and are termed critical
points, that is, points where the curvature (the second derivative) changes sign
are termed inflection points. For example, in the analysis of data from an acid-
base titration, the inflection point is used to determine the equivalence point.
Calculating First and Second Derivatives
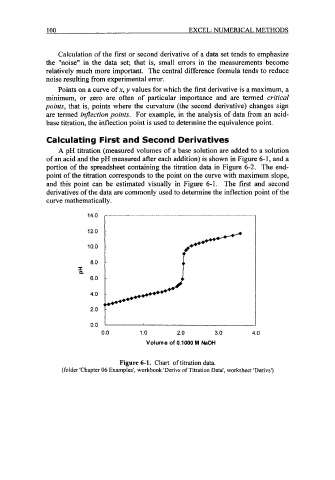
A pH titration (measured volumes of a base solution are added to a solution
of an acid and the pH measured after each addition) is shown in Figure 6- 1, and a
portion of the spreadsheet containing the titration data in Figure 6-2. The end-
point of the titration corresponds to the point on the curve with maximum slope,
and this point can be estimated visually in Figure 6-1. The first and second
derivatives of the data are commonly used to determine the inflection point of the
curve mathematically.
14.0
12.0
10.0
8.0
I
P
6.0
0.0 1 .o 2.0 3.0 4.0
Volume of 0.1000 M NaOH
Figure 6-1. Chart of titration data.
(folder 'Chapter 06 Examples', workbook 'Derivs of Titration Data', worksheet 'Derivs')