
Page 124 - Excel for Scientists and Engineers: Numerical Methods
P. 124
CHAPTER 6 DIFFERENTIATION 101
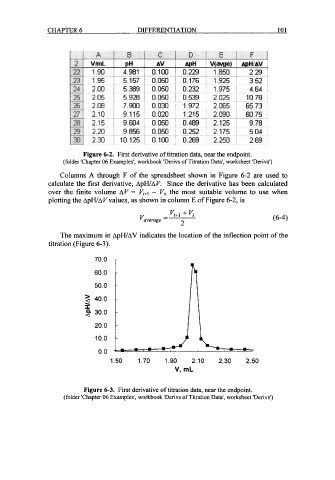
Figure 6-2. First derivative of titration data, near the endpoint.
(folder 'Chapter 06 Examples', workbook 'Derivs of Titration Data', worksheet 'Derivs')
Columns A through F of the spreadsheet shown in Figure 6-2 are used to
calculate the first derivative, ApWAV. Since the derivative has been calculated
over the finite volume AV = K+, - V,, the most suitable volume to use when
plotting the ApWAVvalues, as shown in column E of Figure 6-2, is
The maximum in ApWAV indicates the location of the inflection point of the
titration (Figure 6-3).
70.0
60.0
50.0 i
>a 40.0
1
2 30.0
20.0
Figure 6-3. First derivative of titration data, near the endpoint.
(folder 'Chapter 06 Examples', workbook 'Derivs of Titration Data', worksheet 'Derivs')