
Page 125 - Excel for Scientists and Engineers: Numerical Methods
P. 125
102 EXCEL: NUMERICAL METHODS
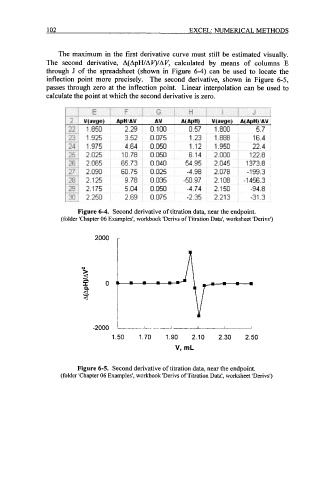
The maximum in the first derivative curve must still be estimated visually.
The second derivative, A[ApWAV)/AV, calculated by means of columns E
through J of the spreadsheet (shown in Figure 6-4) can be used to locate the
inflection point more precisely. The second derivative, shown in Figure 6-5,
passes through zero at the inflection point. Linear interpolation can be used to
calculate the point at which the second derivative is zero.
Figure 6-4. Second derivative of titration data, near the endpoint.
(folder 'Chapter 06 Examples', workbook 'Derivs of Titration Data', worksheet 'Derivs')
I I
1.50 1.70 1.90 2.10 2.30 2.50
V, rnL
Figure 6-5. Second derivative of titration data, near the endpoint.
(folder 'Chapter 06 Examples', workbook 'Derivs of Titration Data', worksheet 'Derivs')