
Page 352 - Excel for Scientists and Engineers: Numerical Methods
P. 352
CHAPTER 14 NONLINEAR REGRESSION USING THE SOLVER 329
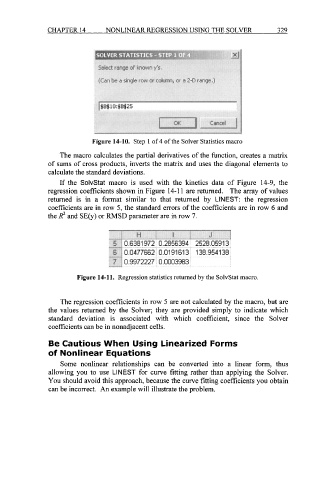
Figure 14-10. Step 1 of 4 of the Solver Statistics macro
The macro calculates the partial derivatives of the function, creates a matrix
of sums of cross products, inverts the matrix and uses the diagonal elements to
calculate the standard deviations.
If the SolvStat macro is used with the kinetics data of Figure 14-9, the
regression coefficients shown in Figure 14-1 1 are returned. The array of values
returned is in a format similar to that returned by LINEST: the regression
coefficients are in row 5, the standard errors of the coefficients are in row 6 and
the R2 and SE(y) or RMSD parameter are in row 7.
Figure 14-11. Regression statistics returned by the SolvStat macro.
The regression coefficients in row 5 are not calculated by the macro, but are
the values returned by the Solver; they are provided simply to indicate which
standard deviation is associated with which coefficient, since the Solver
coefficients can be in nonadjacent cells.
Be Cautious When Using Linearized Forms
of Nonlinear Equations
Some nonlinear relationships can be converted into a linear form, thus
allowing you to use LINEST for curve fitting rather than applying the Solver.
You should avoid this approach, because the curve fitting coefficients you obtain
can be incorrect. An example will illustrate the problem.