Page 356 - Excel for Scientists and Engineers: Numerical Methods
P. 356

CHAPTER 14        NONLINEAR REGRESSION USING THE SOLVER               333


                                   Table 14-2.  Data for simple logistic equation.
                                 1  x  1     Y     1   x  1     v     I
                                   -8      0.01 50     1      0.6198
                                   -7      0.0338      2      0.7292
                                   -6      0.0468      3      0.8177
                                   -5      0.0712      4      0.8843
                                   -4      0.1152      5      0.9206
                                   -3      0.1850      6      0.9547
                                 I   -2  I   0.2716  1   7  I   0.9706  1

                                   -1      0.3775      8      0.9863
                                    0      0.4972     10      0.6198


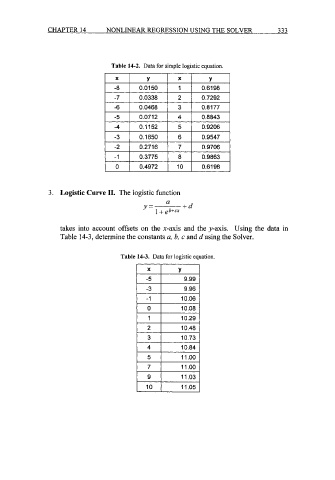
                3.  Logistic Curve 11.  The logistic function
                                                   a
                                            Y=          +d
                                                1 + e b+cx

                   takes  into account  offsets  on  the x-axis  and the y-axis.  Using  the  data in
                   Table 14-3, determine the constants u, b, c and d using the Solver.


                                     Table 14-3.  Data for logistic equation.


                                          I   -1  I     10.06


                                                        10.48
                                                        10.73
                                                        10.84
                                                        11  .oo
                                                        11 .oo
                                          1   9  1      11.03 I
   351   352   353   354   355   356   357   358   359   360   361