
Page 360 - Excel for Scientists and Engineers: Numerical Methods
P. 360
CHAPTER 14 NONLINEAR REGRESSION USING THE SOLVER 337
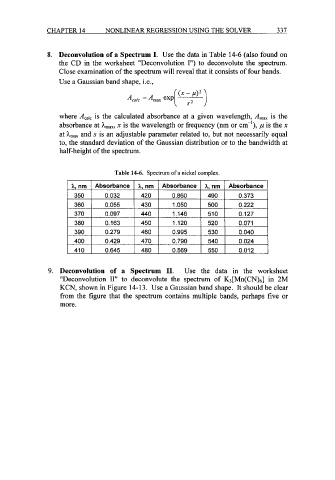
8. Deconvolution of a Spectrum I. Use the data in Table 14-6 (also found on
the CD in the worksheet "Deconvolution I") to deconvolute the spectrum.
Close examination of the spectrum will reveal that it consists of four bands.
Use a Gaussian band shape, i.e.,
where Acalc is the calculated absorbance at a given wavelength, A,,, is the
absorbance at Amax, x is the wavelength or frequency (nm or cm-'), ,u is the x
at A,,, and s is an adjustable parameter related to, but not necessarily equal
to, the standard deviation of the Gaussian distribution or to the bandwidth at
half-height of the spectrum.
Table 14-6. Spectrum of a nickel complex.
9. Deconvolution of a Spectrum 11. Use the data in the worksheet
"Deconvolution 11" to deconvolute the spectrum of K3[Mn(CN)6] in 2M
KCN, shown in Figure 14-13. Use a Gaussian band shape. It should be clear
from the figure that the spectrum contains multiple bands, perhaps five or
more.