
Page 362 - Excel for Scientists and Engineers: Numerical Methods
P. 362
CHAPTER 14 NONLINEAR REGRESSION USING THE SOLVER 339
.o
I
0.8
0.2
0 .o
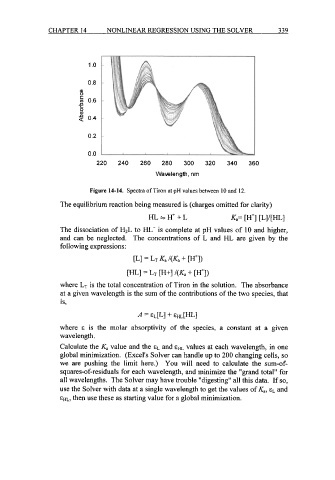
220 240 260 280 300 320 340 360
Wavelength, nrn
Figure 14-14. Spectra of Tiron at pH values between 10 and 12.
The equilibrium reaction being measured is (charges omitted for clarity)
HL=H'+L Ka= [r] [Ll/[HL]
The dissociation of H2L to HL- is complete at pH values of 10 and higher,
and can be neglected. The concentrations of L and HL are given by the
following expressions:
CLI = LT Ka /(Ka + [H+I)
WI = LT W+I /(Ka + [WI)
where LT is the total concentration of Tiron in the solution. The absorbance
at a given wavelength is the sum of the contributions of the two species, that
is,
A = EL[L] -I- EHL[m]
where E is the molar absorptivity of the species, a constant at a given
wavelength.
Calculate the Ka value and the EL and EHL values at each wavelength, in one
global minimization. (Excel's Solver can handle up to 200 changing cells, so
we are pushing the limit here.) You will need to calculate the sum-of-
squares-of-residuals for each wavelength, and minimize the "grand total" for
all wavelengths. The Solver may have trouble "digesting" all this data. If so,
use the Solver with data at a single wavelength to get the values of Ka, E~ and
EHL, then use these as starting value for a global minimization.