
Page 367 - Excel for Scientists and Engineers: Numerical Methods
P. 367
344 EXCEL: NUMERICAL METHODS
Since all of the above formulas include the RAND function, the returned
result is volatile; that is, it changes each time the spreadsheet is modified.
Adding "Noise" to a Signal Generated by a Formula
One of the simplest uses for the RAND function is to add noise to a
theoretical curve generated by means of a formula, so as to simulate a real signal.
In other words, we want to modify our worksheet formula F(x) by adding a
random quantity 6. The 6must be scaled to produce a noise term of suitable
magnitude and the S terms must be equally distributed between positive and
negative. Remember that RAND always returns a number greater than or equal to
0 and less than 1. There are several ways that you can add such a random
quantity, for example,
(original worksheet formula) + scale-factor*( RAND()-0.5)
to produce a noise term of constant magnitude (scale-factor determines the
magnitude of the noise term) or
(original worksheet formula)*( 1 + scale-factor*(RAND()-0.5))
to produce a noise term of constant signal-to-noise ratio. Some people use the
expression RAND()-RAND() instead of RAND()-0.5 to produce equal probability
of positive or negative noise terms.
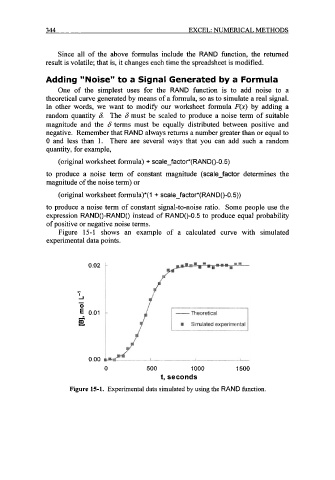
Figure 15-1 shows an example of a calculated curve with simulated
experimental data points.
0.02 -
..
I I
0 500 1000 1500
t, seconds
Figure 15-1. Experimental data simulated by using the RAND function.