
Page 371 - Excel for Scientists and Engineers: Numerical Methods
P. 371
348 EXCEL: NUMERICAL METHODS
The Data Analysis add-in provides a toolbox of statistical analysis tools,
including Analysis of Variance, Correlation, Smoothing, Regression Analysis,
Sampling and others; part of the list of statistical tools is shown in Figure 15-6.
The Sampling tool allows you to do either periodic or random sampling from
a data array. To perform random sampling, choose Data Analysis from the Tools
menu, choose Sampling from the list of tools, and press OK to display the
Sampling dialog box.
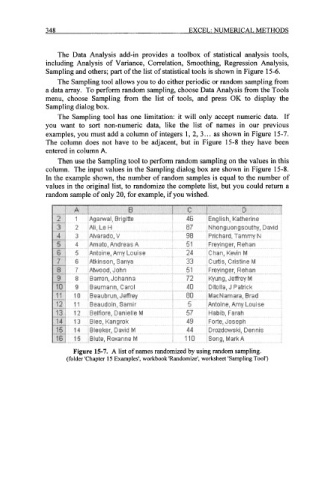
The Sampling tool has one limitation: it will only accept numeric data. If
you want to sort non-numeric data, like the list of names in our previous
examples, you must add a column of integers 1, 2, 3.. . as shown in Figure 15-7.
The column does not have to be adjacent, but in Figure 15-8 they have been
entered in column A.
Then use the Sampling tool to perform random sampling on the values in this
column. The input values in the Sampling dialog box are shown in Figure 15-8.
In the example shown, the number of random samples is equal to the number of
values in the original list, to randomize the complete list, but you could return a
random sample of only 20, for example, if you wished.
Figure 15-7. A list of names randomized by using random sampling.
(folder 'Chapter 15 Examples', workbook 'Randomize', worksheet 'Sampling Tool')