
Page 375 - Excel for Scientists and Engineers: Numerical Methods
P. 375
12
10
8
6
4
2
0
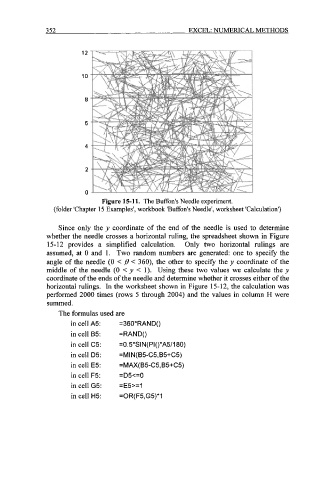
Figure 15-1 1. The Buffon's Needle experiment.
(folder 'Chapter 15 Examples', workbook 'Buffon's Needle', worksheet 'Calculation')
Since only the y coordinate of the end of the needle is used to determine
whether the needle crosses a horizontal ruling, the spreadsheet shown in Figure
15-12 provides a simplified calculation. Only two horizontal rulings are
assumed, at 0 and 1. Two random numbers are generated: one to specify the
angle of the needle (0 < .€J < 360), the other to specify the y coordinate of the
middle of the needle (0 < y < 1). Using these two values we calculate the y
coordinate of the ends of the needle and determine whether it crosses either of the
horizontal rulings. In the worksheet shown in Figure 15-12, the calculation was
performed 2000 times (rows 5 through 2004) and the values in column H were
summed.
The formulas used are
in cell A5: =360*RAN D()
in cell B5: =RAND()
in cell C5: =O. 5*SI N ( PI ()*A511 80)
in cell D5: =MIN( B5-C5,B5+C5)
in cell E5: =MAX( B5-C5, B5+C5)
in cell F5: =~5<=0
in cell G5: =~5>=1
in cell H5: =OR(F5,G5)*1