
Page 380 - Excel for Scientists and Engineers: Numerical Methods
P. 380
CHAPTER 15 RANDOM NUMBERS & MONTE CARL0 METHOD 357
in cell F7: =IF(E7=FALSE,(B6+(B7-B6)*($A$l9-A6)/(A7-A6)-$B$19)>0,"")
and the formula in cell C19 (an array formula) is
{=MOD(SUM(( F6:F14=TRUE)*1),2)<>0}
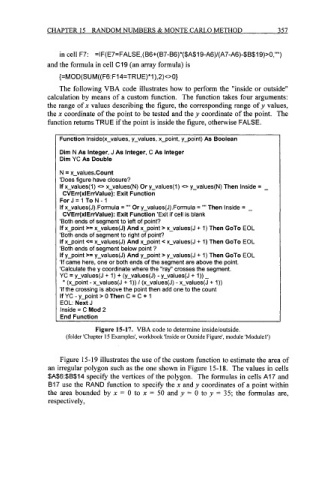
The following VBA code illustrates how to perform the "inside or outside"
calculation by means of a custom function. The function takes four arguments:
the range of x values describing the figure, the corresponding range of y values,
the x coordinate of the point to be tested and the y coordinate of the point. The
function returns TRUE if the point is inside the figure, otherwise FALSE.
Function Inside(x-values, y-values, x-point, y-point) As Boolean
Dim N As Integer, J As Integer, C As Integer
Dim YC As Double
N = x-values.Count
'Does figure have closure?
If x-values(1) <> x-values(N) Or y-values(1) <> y-values(N) Then Inside = -
CVErr(xlErrVa1ue): Exit Function
ForJ=IToN-l
If x-values(J).Formula = "" Or y-values(J).Formula = "I' Then Inside = -
CVErr(xlErrVa1ue): Exit Function 'Exit if cell is blank
'Both ends of segment to left of point?
If x-point >= x-values(J) And x-point > x-values(J + 1) Then GoTo EOL
'Both ends of segment to right of point?
If x-point <= x-values(J) And x-point < x-values(J + 1) Then GoTo EOL
'Both ends of segment below point ?
If ygoint >= y-values(J) And y-point > y-values(J + 1) Then GoTo EOL
'If came here, one or both ends of the segment are above the point.
'Calculate the y coordinate where the "ray" crosses the segment.
YC = y-values(J + 1) + (y-values(J) - y-values(J + 1)) -
* (x-point - x-values(J + 1)) I (x-values(J) - x-values(J + 1))
'if the crossing is above the point then add one to the count
If YC - y-point > 0 Then C = C + 1
EOL: Next J
Inside = C Mod 2
End Function
Figure 15-17. VBA code to determine insideloutside.
(folder 'Chapter 15 Examples', workbook 'Inside or Outside Figure', module 'Modulel')
Figure 15-19 illustrates the use of the custom function to estimate the area of
an irregular polygon such as the one shown in Figure 15-18. The values in cells
$A$6:$B$14 specify the vertices of the polygon. The formulas in cells A17 and
B17 use the RAND function to specify the x and y coordinates of a point within
the area bounded by x = 0 to x = 50 and y = 0 to y = 35; the formulas are,
respectively,