
Page 383 - Excel for Scientists and Engineers: Numerical Methods
P. 383
360 EXCEL: NUMERICAL METHODS
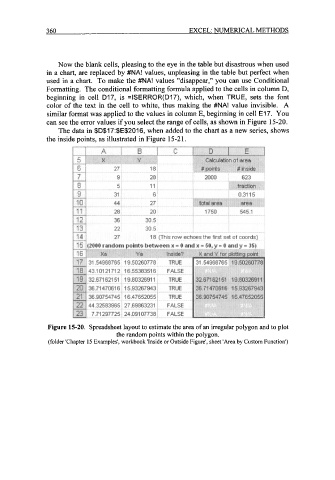
Now the blank cells, pleasing to the eye in the table but disastrous when used
in a chart, are replaced by #NA! values, unpleasing in the table but perfect when
used in a chart. To make the #NA! values "disappear," you can use Conditional
Formatting. The conditional formatting formula applied to the cells in column D,
beginning in cell D17, is =ISERROR(D17), which, when TRUE, sets the font
color of the text in the cell to white, thus making the #NA! value invisible. A
similar format was applied to the values in column E, beginning in cell E17. You
can see the error values if you select the range of cells, as shown in Figure 15-20.
The data in $D$17:$E$2016, when added to the chart as a new series, shows
the inside points, as illustrated in Figure 15-2 1.
Figure 15-20. Spreadsheet layout to estimate the area of an irregular polygon and to plot
the random points within the polygon.
(folder 'Chapter 15 Examples', workbook 'Inside or Outside Figure', sheet 'Area by Custom Function')