
Page 361 - Excel for Scientists and Engineers: Numerical Methods
P. 361
338 EXCEL: NUMERICAL METHODS
1.8
1.6 Spectrum of K3[Mn(CN),]
1.4 1 k in2MKCN
3 1.2
5 1.0
e
$ 0.8
9 0.6
0.4
0.2
0.0 c
200 250 300 350 400
Wavelength, nrn
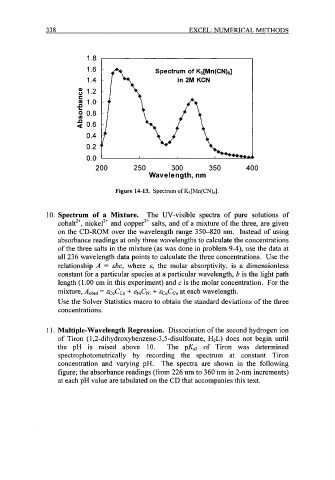
Figure 14-13. Spectrum of K3[Mn(CN)6].
10. Spectrum of a Mixture. The W-visible spectra of pure solutions of
cobalt2+, nickel2' and copper2+ salts, and of a mixture of the three, are given
on the CD-ROM over the wavelength range 350-820 nm. Instead of using
absorbance readings at only three wavelengths to calculate the concentrations
of the three salts in the mixture (as was done in problem 9-4), use the data at
all 236 wavelength data points to calculate the three concentrations. Use the
relationship A = E~C, where E, the molar absorptivity, is a dimensionless
constant for a particular species at a particular wavelength, b is the light path
length (1 .OO cm in this experiment) and c is the molar concentration. For the
~
~
C+ E
~
at
mixture, Aobsd = E ~ + EN~CN~ ~ ~ ~ ~each wavelength.
C
Use the Solver Statistics macro to obtain the standard deviations of the three
concentrations.
1 1. Multiple-Wavelength Regression. Dissociation of the second hydrogen ion
of Tiron ( 1,2-dihydroxybenzene-3,5-disulfonate, H2L) does not begin until
the pH is raised above 10. The pKaz of Tiron was determined
spectrophotometrically by recording the spectrum at constant Tiron
concentration and varying pH. The spectra are shown in the following
figure; the absorbance readings (from 226 nm to 360 nm in 2-nm increments)
at each pH value are tabulated on the CD that accompanies this text.