
Page 456 - Excel for Scientists and Engineers: Numerical Methods
P. 456
APPENDIX 8 ANSWERS AND COMMENTS FOR PROBLEMS 433
interpolation. If you use this approach, you must sort the data table so that
the x values are in ascending order. Answer: 34.9%.
3. Answers: 3.3423 1 , 5.40473.
4. Answers: 1.52, 1.18.
5. Data from .I Research National Bureau of Standards, 68A, 489 (1964).
Answers: 1.50173, 1.48727, 1.52508, 1.53731, #VALUE!
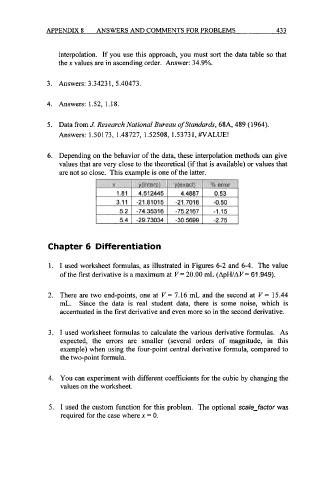
6. Depending on the behavior of the data, these interpolation methods can give
values that are very close to the theoretical (if that is available) or values that
are not so close. This example is one of the latter.
Chapter 6 Differentiation
1. I used worksheet formulas, as illustrated in Figures 6-2 and 6-4. The value
of the first derivative is a maximum at V= 20.00 mL (ApWAV= 61.949).
2. There are two end-points, one at V = 7.16 mL and the second at V = 15.44
mL. Since the data is real student data, there is some noise, which is
accentuated in the first derivative and even more so in the second derivative.
3. I used worksheet formulas to calculate the various derivative formulas. As
expected, the errors are smaller (several orders of magnitude, in this
example) when using the four-point central derivative formula, compared to
the two-point formula.
4. You can experiment with different coefficients for the cubic by changing the
values on the worksheet.
5. I used the custom function for this problem. The optional scale-factor was
required for the case where x = 0.