
Page 179 - Failure Analysis Case Studies II
P. 179
164
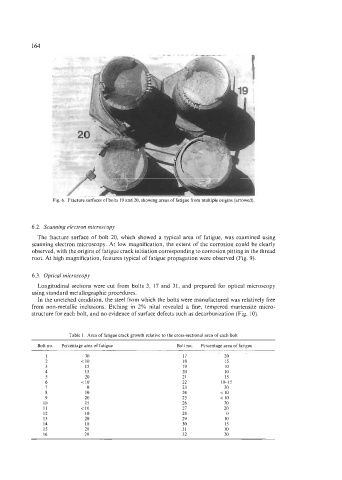
Fig. 6. Fracture surfaces of bolts 19 and 20, showing areas of fatigue from multiple origins (arrowed).
6.2. Scanning electron microscopy
The fracture surface of bolt 20, which showed a typical area of fatigue, was examined using
scanning electron microscopy. At low magnification, the extent of the corrosion could be clearly
observed, with the origins of fatigue crack initiation corresponding to corrosion pitting in the thread
root. At high magnification, features typical of fatigue propagation were observed (Fig. 9).
6.3. Optical microscopy
Longitudinal sections were cut from bolts 3, 17 and 31, and prepared for optical microscopy
using standard metallographic procedures.
In the unetched condition, the steel from which the bolts were manufactured was relatively free
from non-metallic inclusions. Etching in 2% nital revealed a fine, tempered martensite micro-
structure for each bolt, and no evidence of surface defects such as decarburization (Fig. IO).
Table 1. Area of fatigue crack growth relative to the cross-sectional area of each bolt
Bolt no. Percentage area of fatigue Bolt no. Percentage area of fatigue
30 11 20
< 10 18 15
15 19 10
4 15 20 10
5 20 21 15
< 10 22 10-15
0 23 20
10 24 < 10
9 20 25 < 10
10 15 26 30
11 < 10 21 20
12 10 28 0
13 20 29 10
14 10 30 15
15 20 31 10
16 20 32 20