
Page 418 - Failure Analysis Case Studies II
P. 418
402
I'
0 I I
0 4000 8000 12 000 16000 20000
TIME ( Sec) 4
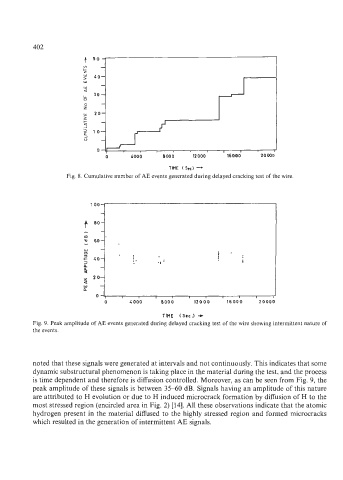
Fig. 8. Cumulative number of AE events generated during delayed cracking test of the wire.
'4i
a 0 0 4 000 8000 12000 16000 20000
TIME (See.) -t
Fig. 9. Peak amplitude of AE events generated during delayed cracking test of the wire showing intermittent nature of
the events.
noted that these signals were generated at intervals and not continuously. This indicates that some
dynamic substructural phenomenon is taking place in the material during the test, and the process
is time dependent and therefore is diffusion controlled. Moreover, as can be seen from Fig. 9, the
peak amplitude of these signals is between 35-60 dB. Signals having an amplitude of this nature
are attributed to H evolution or due to H induced microcrack formation by diffusion of H to the
most stressed region (encircled area in Fig. 2) [14]. All these observations indicate that the atomic
hydrogen present in the material diffused to the highly stressed region and formed microcracks
which resulted in the generation of intermittent AE signals.