
Page 416 - Failure Analysis Case Studies II
P. 416
400
Table 1
Tensile and impact test results
Specimen YO Elongation 0.2% YS (MPa) UTS (MPa) Impact toughness (J)
As-received* 3.02 1433 2204 33.7
Baked (250OC)a 5.32 1543 2178 33.3
“Values reported are the average of three specimens.
c
2400
2000
1600
:
h
1200
v)
3
v)
800
400
0
0 1 2 3 4 5 6
Shin, %
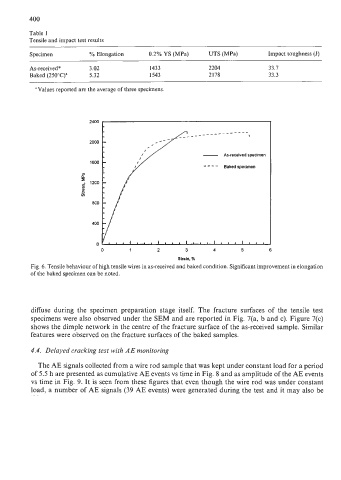
Fig. 6. Tensile behaviour of high tensile wires in as-received and baked condition. Significant improvement in elongation
of the baked specimen can be noted.
diffuse during the specimen preparation stage itself. The fracture surfaces of the tensile test
specimens were also observed under the SEN and are reported in Fig. 7(a, b and c). Figure 7(c)
shows the dimple network in the centre of the fracture surface of the as-received sample. Similar
features were observed on the fracture surfaces of the baked samples.
4.4. Delayed cracking test with AE monitoring
The AE signals collected from a wire rod sample that was kept under constant load for a period
of 5.5 h are presented as cumulative AE events vs time in Fig. 8 and as amplitude of the AE events
vs time in Fig. 9. It is seen from these figures that even though the wire rod was under constant
load, a number of AE signals (39 AE events) were generated during the test and it may also be