Page 123 - Fair, Geyer, and Okun's Water and wastewater engineering : water supply and wastewater removal
P. 123

JWCL344_ch03_061-117.qxd  8/17/10  7:48 PM  Page 85


                                                                                       3.11 Prediction of Drawdown  85
                    3.11.2 Variable Discharge

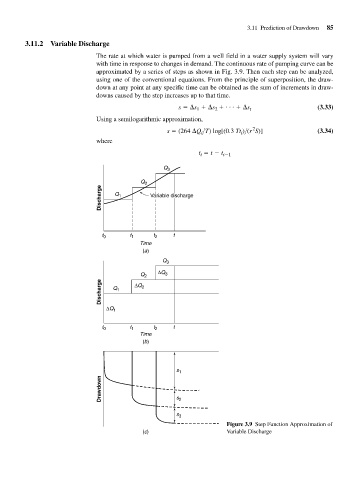
                                         The rate at which water is pumped from a well field in a water supply system will vary
                                         with time in response to changes in demand. The continuous rate of pumping curve can be
                                         approximated by a series of steps as shown in Fig. 3.9. Then each step can be analyzed,
                                         using one of the conventional equations. From the principle of superposition, the draw-
                                         down at any point at any specific time can be obtained as the sum of increments in draw-
                                         downs caused by the step increases up to that time.
                                                                  s   s 1   s 2     . . .    s t             (3.33)

                                         Using a semilogarithmic approximation,
                                                                                         2
                                                               s   (264  Q i >T) log[(0.3 Tt i )>(r S)]      (3.34)
                                         where

                                                                         t i   t   t i 1
                                                              Q 3

                                                       Q 2
                                           Discharge  Q 1  Variable discharge


                                           t 0      t 1    t 2   t
                                                       Time
                                                        (a)
                                                              Q 3
                                                       Q 2  ΔQ 3
                                           Discharge  Q 1  ΔQ 2


                                             ΔQ 1

                                           t 0      t 1    t 2   t
                                                       Time
                                                        (b)


                                                                  s 1
                                           Drawdown               s 2


                                                                  s 3
                                                                                 Figure 3.9 Step Function Approximation of
                                                        (c)                      Variable Discharge
   118   119   120   121   122   123   124   125   126   127   128