
Page 189 - Fair, Geyer, and Okun's Water and wastewater engineering : water supply and wastewater removal
P. 189
JWCL344_ch04_118-153.qxd 8/2/10 9:18 PM Page 151
4.9 Design Flows for Water Infrastructure Development 151
requirements. The design period should be based on the ultimate tributary population and
usually ranges from 25 to 30 years.
4.9 DESIGN FLOWS FOR WATER INFRASTRUCTURE DEVELOPMENT
Of 50 municipalities surveyed in 1993 by the Water Environment Association of Ontario
(WEAO), 45 reported ratios of annual wastewater treated to water produced ranging from
0.5 to 2.0, and 5 reported ratios from 2.0 to 4.0. Simple ratios such as these fail to provide
a perspective on real life. Ratios tend to obscure the reality of our less than perfect world—
a world with leaky sewers, water losses, inaccuracies in metering, and the need for large
volumes of water for irrigation—and should be largely ignored. The path from water treat-
ment plant (WTP) to wastewater treatment plant (WWTP) is far from predictable.
It is only by disaggregating daily water demand and daily wastewater flow that their re-
lationship can be understood. Geerts, Goodings, and Davidson (1966) disaggregated several
years of daily water production and wastewater treatment records for three Ontario commu-
nities, referred to as C1, C2, and C3, shown in Table 4.19. By estimating dry-weather waste-
water flow and normal water use, and comparing these with yearly averages (i.e., average
over 365 days, including the “extremes”), first cut estimates on the contribution of inflow/
infiltration (I/I) to the WWTP and the amount of water used for irrigation could be made.
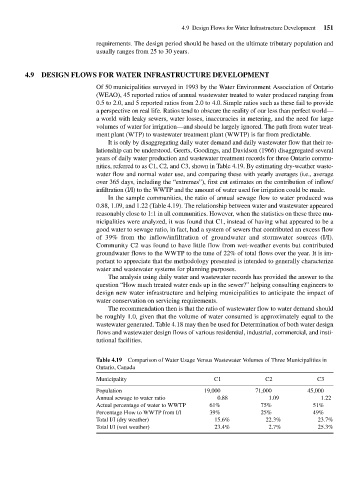
In the sample communities, the ratio of annual sewage flow to water produced was
0.88, 1.09, and 1.22 (Table 4.19). The relationship between water and wastewater appeared
reasonably close to 1:1 in all communities. However, when the statistics on these three mu-
nicipalities were analyzed, it was found that C1, instead of having what appeared to be a
good water to sewage ratio, in fact, had a system of sewers that contributed an excess flow
of 39% from the inflow/infiltration of groundwater and stormwater sources (I/I).
Community C2 was found to have little flow from wet-weather events but contributed
groundwater flows to the WWTP to the tune of 22% of total flows over the year. It is im-
portant to appreciate that the methodology presented is intended to generally characterize
water and wastewater systems for planning purposes.
The analysis using daily water and wastewater records has provided the answer to the
question “How much treated water ends up in the sewer?” helping consulting engineers to
design new water infrastructure and helping municipalities to anticipate the impact of
water conservation on servicing requirements.
The recommendation then is that the ratio of wastewater flow to water demand should
be roughly 1.0, given that the volume of water consumed is approximately equal to the
wastewater generated. Table 4.18 may then be used for Determination of both water design
flows and wastewater design flows of various residential, industrial, commercial, and insti-
tutional facilities.
Table 4.19 Comparison of Water Usage Versus Wastewater Volumes of Three Municipalities in
Ontario, Canada
Municipality C1 C2 C3
Population 19,000 71,000 45,000
Annual sewage to water ratio 0.88 1.09 1.22
Actual percentage of water to WWTP 61% 75% 51%
Percentage Flow to WWTP from I/I 39% 25% 49%
Total I/I (dry weather) 15.6% 22.3% 23.7%
Total I/I (wet weather) 23.4% 2.7% 25.3%