
Page 184 - Fair, Geyer, and Okun's Water and wastewater engineering : water supply and wastewater removal
P. 184
JWCL344_ch04_118-153.qxd 8/2/10 9:18 PM Page 146
146 Chapter 4 Quantities of Water and Wastewater Flows
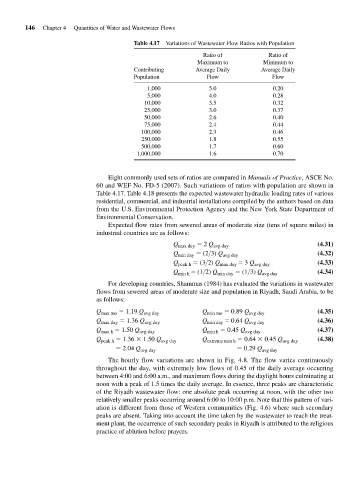
Table 4.17 Variations of Wastewater Flow Ratios with Population
Ratio of Ratio of
Maximum to Minimum to
Contributing Average Daily Average Daily
Population Flow Flow
1,000 5.0 0.20
5,000 4.0 0.28
10,000 3.5 0.32
25,000 3.0 0.37
50,000 2.6 0.40
75,000 2.4 0.44
100,000 2.3 0.46
250,000 1.8 0.55
500,000 1.7 0.60
1,000,000 1.6 0.70
Eight commonly used sets of ratios are compared in Manuals of Practice, ASCE No.
60 and WEF No. FD-5 (2007). Such variations of ratios with population are shown in
Table 4.17. Table 4.18 presents the expected wastewater hydraulic loading rates of various
residential, commercial, and industrial installations compiled by the authors based on data
from the U.S. Environmental Protection Agency and the New York State Department of
Environmental Conservation.
Expected flow rates from sewered areas of moderate size (tens of square miles) in
industrial countries are as follows:
Q max day 2 Q avg day (4.31)
Q min day (2>3) Q avg day (4.32)
Q peak h (3>2) Q max day 3 Q avg day (4.33)
Q min h (1>2) Q min day (1>3) Q avg day (4.34)
For developing countries, Shammas (1984) has evaluated the variations in wastewater
flows from sewered areas of moderate size and population in Riyadh, Saudi Arabia, to be
as follows:
Q max mo 1.19 Q avg day Q min mo 0.89 Q avg day (4.35)
Q max day 1.36 Q avg day Q min day 0.64 Q avg day (4.36)
Q max h 1.50 Q avg day Q min h 0.45 Q avg day (4.37)
Q peak h 1.36 1.50 Q avg day Q extreme min h 0.64 0.45 Q avg day (4.38)
2.04 Q avg day 0.29 Q avg day
The hourly flow variations are shown in Fig. 4.8. The flow varies continuously
throughout the day, with extremely low flows of 0.45 of the daily average occurring
between 4:00 and 6:00 a.m., and maximum flows during the daylight hours culminating at
noon with a peak of 1.5 times the daily average. In essence, three peaks are characteristic
of the Riyadh wastewater flow: one absolute peak occurring at noon, with the other two
relatively smaller peaks occurring around 6:00 to 10:00 p.m. Note that this pattern of vari-
ation is different from those of Western communities (Fig. 4.6) where such secondary
peaks are absent. Taking into account the time taken by the wastewater to reach the treat-
ment plant, the occurrence of such secondary peaks in Riyadh is attributed to the religious
practice of ablution before prayers.