Page 183 - Fair, Geyer, and Okun's Water and wastewater engineering : water supply and wastewater removal
P. 183

JWCL344_ch04_118-153.qxd  8/2/10  9:18 PM  Page 145


                                                                                  4.7 Variations in Wastewater Flows  145
                                         for which shape as well as size are governing factors. Low flows edge upward and high
                                         flows move downward. Indeed, wastewater and stormwater flows are quite like stream and
                                         flood flows and hence subject also to analysis by flood-routing procedures.
                                             H. M. Gifft (1945) has evaluated damping effects by the following observational
                                         relationships:

                                                                     Q max day >Q avg day    5.0P  1>6       (4.23)
                                                                     Q min day >Q avg day    0.2P 1>6        (4.24)
                                                                     Q max day >Q min day    25.0P  1>3      (4.25)

                                         Here Q max day , Q avg day , and Q min day  are, respectively, the maximum, average, and mini-
                                          mum daily rates of flow of spent water and P is the population in thousands.
                                             The most commonly used ratio is Q max day /Q avg day , which is known as the peaking
                                          factor, PF. In this way the maximum flow is calculated by multiplying the average flow
                                          by the peaking factor:
                                                                                                             (4.26)
                                                                   Q max day   PF   Q avg day
                                             Other common variable peaking factor (PF) calculation methods include the following:

                                                                                     5.0
                                                              Babbitt :        PF =   0.2                    (4.27)
                                                                                     P
                                                                                             14.0
                                                              Harmon:          PF = 1.0 +        0.5         (4.28)
                                                                                          4.0 + P
                                                                                     18 + 2P
                                                              Ten-States Standards: PF =                     (4.29)
                                                                                     4 + 2P
                                                                                      2.69
                                                              Federov:         PF =   0.121                  (4.30)
                                                                                     Q avg day
                                         where P is the population, in thousands; and Q avg day  is the average daily flow, in L/s.
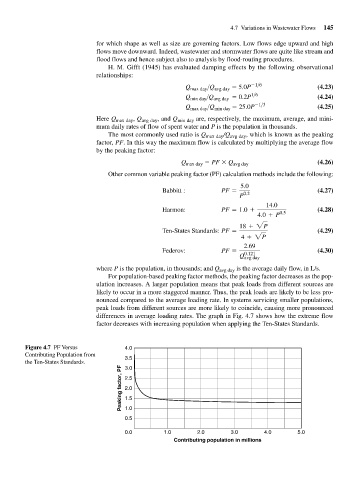
                                             For population-based peaking factor methods, the peaking factor decreases as the pop-
                                          ulation increases. A larger population means that peak loads from different sources are
                                          likely to occur in a more staggered manner. Thus, the peak loads are likely to be less pro-
                                          nounced compared to the average loading rate. In systems servicing smaller populations,
                                          peak loads from different sources are more likely to coincide, causing more pronounced
                                          differences in average loading rates. The graph in Fig. 4.7 shows how the extreme flow
                                          factor decreases with increasing population when applying the Ten-States Standards.


                    Figure 4.7 PF Versus          4.0
                    Contributing Population from  3.5
                    the Ten-States Standards.     3.0
                                                 Peaking factor, PF  2.5


                                                  2.0
                                                  1.5
                                                  1.0
                                                  0.5
                                                  0.0         1.0       2.0       3.0       4.0        5.0
                                                                 Contributing population in millions
   178   179   180   181   182   183   184   185   186   187   188