
Page 179 - Fair, Geyer, and Okun's Water and wastewater engineering : water supply and wastewater removal
P. 179
JWCL344_ch04_118-153.qxd 8/2/10 9:18 PM Page 141
4.5 Demand and Drainage Loads of Buildings 141
Table 4.15 Fixture Rates
3
Rates of Supply and Discharge, ft /min
Type of Fixture and Supply (1) Private Public and
and Discharge (2) Buildings Office Buildings
Wash basin, faucet—(1) and (2) 1 2
Water closet, (2) only 6 8
flush tank, (1) only 3 5
flush valve, (1) only 6 10
Urinal
(stall or wall), flush tank (1) only . . . 3
(stall or wall), flush valve . . . 5
(pedestal), flush valve . . . 10
Bathtub or shower, faucet or mixing valve 2 4
Bathroom group (2) only 8 . . .
flush tank for closet, (1) only 6 . . .
flush valve for closet, (1) only 8 . . .
separate shower head, (1) only 2 . . .
separate shower stall, (2) only 10 . . .
Kitchen sink, faucet 2 2 4
Laundry trays (1 to 3), faucet 3 . . .
Combination fixture, faucet 3 . . .
Service sink, faucet (hotel or restaurant) . . . 3
Sill cock 2 3 2 3
3
3
Conversion factor: 1 ft /min 28.32 L/min 0.02832 m /min.
3. Fixtures supplied with both hot and cold water exert reduced demands on main
hot-water and cold-water branches (not fixture branches). An allowance of three-
fourths of the demand shown in Table 4.15 for individual fixtures is suggested.
3
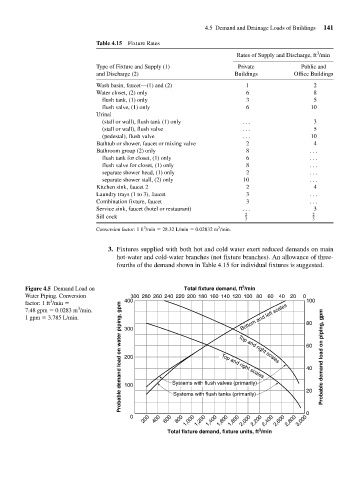
Figure 4.5 Demand Load on Total fixture demand, ft /min
Water Piping. Conversion 300 280 260 240 220 200 180 160 140 120 100 80 60 40 20 0
3
factor: 1 ft /min 400 100
Probable demand load on water piping, gpm 200 Systems with flush valves (primarily) 60 Probable demand load on piping, gpm
3
7.48 gpm 0.0283 m /min.
1 gpm 3.785 L/min. 300 Bottom and left scales 80
Top and right scales
40
Top and right scales
100
0
200 400 600 800 1,000 1,200 1,400 1,600 1,800 2,000 2,200 2,400 2,600 2,800 3,000
0 Systems with flush tanks (primarily) 20
3
Total fixture demand, fixture units, ft /min