
Page 181 - Fair, Geyer, and Okun's Water and wastewater engineering : water supply and wastewater removal
P. 181
JWCL344_ch04_118-153.qxd 8/2/10 9:18 PM Page 143
4.6 Wastewater Flows 143
Table 4.16 Residential Wastewater Flows
Average Flow
City (gpcd)
Denver, Colorado 69
Los Angeles, California 90
Milwaukee, Wsconsin 64
Phoenix, Arizona 78
Riyadh, Saudi Arabia 70
San Diego, California 58
Seattle, Washington 57
Stamford, Connecticut 80
Tampa, Florida 66
USA 65
Conversion factor: 1 gpcd 3.785 Lpcd.
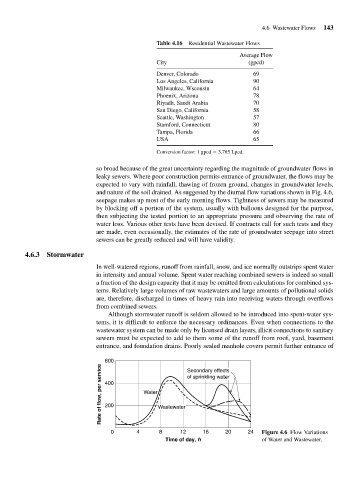
so broad because of the great uncertainty regarding the magnitude of groundwater flows in
leaky sewers. Where poor construction permits entrance of groundwater, the flows may be
expected to vary with rainfall, thawing of frozen ground, changes in groundwater levels,
and nature of the soil drained. As suggested by the diurnal flow variations shown in Fig. 4.6,
seepage makes up most of the early morning flows. Tightness of sewers may be measured
by blocking off a portion of the system, usually with balloons designed for the purpose,
then subjecting the tested portion to an appropriate pressure and observing the rate of
water loss. Various other tests have been devised. If contracts call for such tests and they
are made, even occasionally, the estimates of the rate of groundwater seepage into street
sewers can be greatly reduced and will have validity.
4.6.3 Stormwater
In well-watered regions, runoff from rainfall, snow, and ice normally outstrips spent water
in intensity and annual volume. Spent water reaching combined sewers is indeed so small
a fraction of the design capacity that it may be omitted from calculations for combined sys-
tems. Relatively large volumes of raw wastewaters and large amounts of pollutional solids
are, therefore, discharged in times of heavy rain into receiving waters through overflows
from combined sewers.
Although stormwater runoff is seldom allowed to be introduced into spent-water sys-
tems, it is difficult to enforce the necessary ordinances. Even when connections to the
wastewater system can be made only by licensed drain layers, illicit connections to sanitary
sewers must be expected to add to them some of the runoff from roof, yard, basement
entrance, and foundation drains. Poorly sealed manhole covers permit further entrance of
600 of sprinkling water
Rate of flow, per service 400 Water Wastewater
Secondary effects
200
0 4 8 12 16 20 24 Figure 4.6 Flow Variations
Time of day, h of Water and Wastewater.