
Page 187 - Fair, Geyer, and Okun's Water and wastewater engineering : water supply and wastewater removal
P. 187
JWCL344_ch04_118-153.qxd 8/17/10 3:59 PM Page 149
4.7 Variations in Wastewater Flows 149
Table 4.18 (continued)
Flow Rate Per Flow Rate Per
Type of Facility or Development Person (gpcd) Unit (gpud)
Schools (Per Student) 16
General 75
Boarding 10
Day, Cafeteria Add 5
Day, Showers Add 5
Service Stations
Per Toilet (Not Including Car Wash) 400
Shopping Centers
2
Per ft —Food Extra 0.1
Per Employee 15
Per Toilet 400
Swimming Pools (Per Swimmer) 10
Sports Stadium 5
Theatre
Drive-in (Per Space) 20
Movie (Per Seat) 20
Dinner Theatre, Individual (Per Seat) 20
with Hotel 10
Warehouse, General
(Per Acre) 600
Conversion factors: 1 gal/day/person 1 gpcd 3.785 Lpcd; 1 gal/day/unit 1 gpud 3.785 Lpud; 1 1 ft
2
0.3048 m; 1 acre 0.4046 ha; 1 square foot 1 sq. ft. 0.929 m .
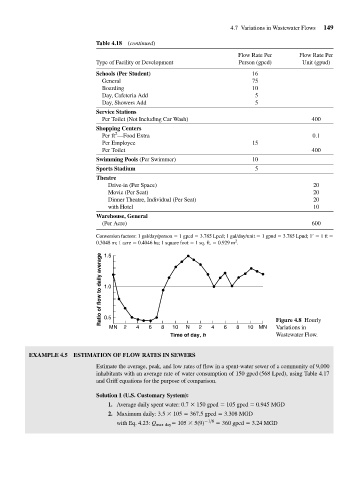
Ratio of flow to daily average 1.0
1.5
0.5
MN 2 4 6 8 10 N 2 4 6 8 10 MN Figure 4.8 Hourly
Variations in
Time of day, h Wastewater Flow.
EXAMPLE 4.5 ESTIMATION OF FLOW RATES IN SEWERS
Estimate the average, peak, and low rates of flow in a spent-water sewer of a community of 9,000
inhabitants with an average rate of water consumption of 150 gpcd (568 Lpcd), using Table 4.17
and Griff equations for the purpose of comparison.
Solution 1 (U.S. Customary System):
1. Average daily spent water: 0.7 150 gpcd 105 gpcd 0.945 MGD
2. Maximum daily: 3.5 105 367.5 gpcd 3.308 MGD
with Eq. 4.23: Q max day 105 5(9) 1>6 360 gpcd 3.24 MGD