
Page 219 - Fair, Geyer, and Okun's Water and wastewater engineering : water supply and wastewater removal
P. 219
JWCL344_ch05_154-193.qxd 8/2/10 9:44 PM Page 181
5.7 Location 181
+
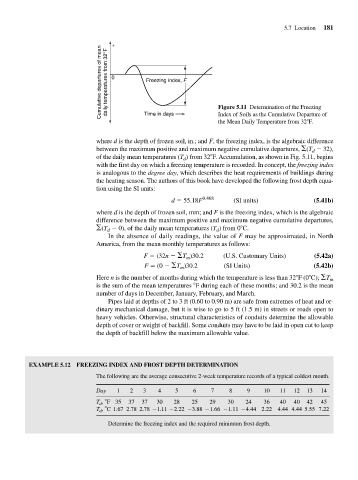
Cumulative departures of mean daily temperatures from 32°F 0 Freezing index, F
Figure 5.11 Determination of the Freezing
Time in days
Index of Soils as the Cumulative Departure of
the Mean Daily Temperature from 32 F.
where d is the depth of frozen soil, in.; and F, the freezing index, is the algebraic difference
between the maximum positive and maximum negative cumulative departures, (T 32),
d
of the daily mean temperatures (T ) from 32 F. Accumulation, as shown in Fig. 5.11, begins
d
with the first day on which a freezing temperature is recorded. In concept, the freezing index
is analogous to the degree day, which describes the heat requirements of buildings during
the heating season. The authors of this book have developed the following frost depth equa-
tion using the SI units:
d 55.18F 0.468 (SI units) (5.41b)
where d is the depth of frozen soil, mm; and F is the freezing index, which is the algebraic
difference between the maximum positive and maximum negative cumulative departures,
(T 0), of the daily mean temperatures (T ) from 0 C.
d
d
In the absence of daily readings, the value of F may be approximated, in North
America, from the mean monthly temperatures as follows:
F (32n T )30.2 (U.S. Customary Units) (5.42a)
m
F (0 T )30.2 (SI Units) (5.42b)
m
Here n is the number of months during which the temperature is less than 32 F (0 C); T m
is the sum of the mean temperatures F during each of these months; and 30.2 is the mean
number of days in December, January, February, and March.
Pipes laid at depths of 2 to 3 ft (0.60 to 0.90 m) are safe from extremes of heat and or-
dinary mechanical damage, but it is wise to go to 5 ft (1.5 m) in streets or roads open to
heavy vehicles. Otherwise, structural characteristics of conduits determine the allowable
depth of cover or weight of backfill. Some conduits may have to be laid in open cut to keep
the depth of backfill below the maximum allowable value.
EXAMPLE 5.12 FREEZING INDEX AND FROST DEPTH DETERMINATION
The following are the average consecutive 2-week temperature records of a typical coldest month.
Day 1 2 3 4 5 6 7 8 9 10 11 12 13 14
T d , F 35 37 37 30 28 25 29 30 24 36 40 40 42 45
T d , C 1.67 2.78 2.78 1.11 2.22 3.88 1.66 1.11 4.44 2.22 4.44 4.44 5.55 7.22
Determine the freezing index and the required minimum frost depth.