
Page 490 - Fair, Geyer, and Okun's Water and wastewater engineering : water supply and wastewater removal
P. 490
JWCL344_ch12_398-456.qxd 8/4/10 9:37 PM Page 448
448 Chapter 12 Urban Runoff and Combined Sewer Overflow Management
The following decision analysis methods, which are listed in order from the most qualita-
tive to the most quantitative, can be utilized:
1. Holistic
2. Cost/benefit ratios
3. Matrix comparisons
4. Decision factor analysis
5. Optimization.
Holistic. This approach is qualitative and relies on certain basic facts, intuition, and pro-
fessional judgment. One key deciding factor (e.g., cost) can guide the process. Given the
inherent complexity of assessing alternative urban runoff control plans and the large num-
ber of available inputs to the decision, this approach is usually oversimplified. Selecting an
appropriate plan from the developed alternatives will generally require an assessment of
multiple factors and should be done in as quantitative a manner as is reasonably possible.
Cost/Benefit Ratios. The relative value of different alternatives can be measured using
cost/benefit ratios, such as cost per pound of pollutant removed or cost per day of effect on
resources. This approach can be used as a tool to determine which BMP should be used
first. For example, if it is determined that reducing solids using source control measures
costs less per pound than using a structural BMP, then source control measures should be
utilized first. Since the unit cost of source control measures increases with the amount of
solids eliminated, the cost per pound of solids removed increases with the number of
pounds removed. The extent to which source control measures should be used for pollutant
removal is then given by the point at which the marginal cost/benefit ratio (i.e., change in
cost/change in benefit) becomes larger than that of another alternative.
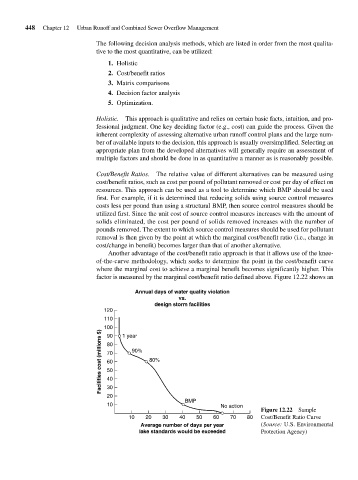
Another advantage of the cost/benefit ratio approach is that it allows use of the knee-
of-the-curve methodology, which seeks to determine the point in the cost/benefit curve
where the marginal cost to achieve a marginal benefit becomes significantly higher. This
factor is measured by the marginal cost/benefit ratio defined above. Figure 12.22 shows an
Annual days of water quality violation
vs.
design storm facilities
120
110 1 year
Facilities cost (millions $) 100 90% 80%
90
80
70
60
50
40
30
20
BMP
10 No action
Figure 12.22 Sample
10 20 30 40 50 60 70 80 Cost/Benefit Ratio Curve
Average number of days per year (Source: U.S. Environmental
lake standards would be exceeded Protection Agency)