
Page 495 - Fair, Geyer, and Okun's Water and wastewater engineering : water supply and wastewater removal
P. 495
JWCL344_ch12_398-456.qxd 8/4/10 9:37 PM Page 453
12.7 Selection of Best Management Practices 453
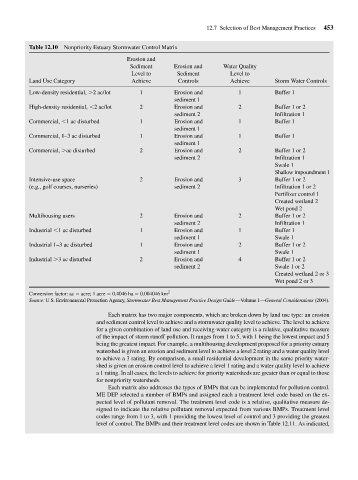
Table 12.10 Nonpriority Estuary Stormwater Control Matrix
Erosion and
Sediment Erosion and Water Quality
Level to Sediment Level to
Land Use Category Achieve Controls Achieve Storm Water Controls
Low-density residential, 2 ac/lot 1 Erosion and 1 Buffer 1
sediment 1
High-density residential, 2 ac/lot 2 Erosion and 2 Buffer 1 or 2
sediment 2 Infiltration 1
Commercial, 1 ac disturbed 1 Erosion and 1 Buffer 1
sediment 1
Commercial, 1–3 ac disturbed 1 Erosion and 1 Buffer 1
sediment 1
Commercial, ac disturbed 2 Erosion and 2 Buffer 1 or 2
sediment 2 Infiltration 1
Swale 1
Shallow impoundment 1
Intensive-use space 2 Erosion and 3 Buffer 1 or 2
(e.g., golf courses, nurseries) sediment 2 Infiltration 1 or 2
Fertilizer control 1
Created wetland 2
Wet pond 2
Multihousing users 2 Erosion and 2 Buffer 1 or 2
sediment 2 Infiltration 1
Industrial 1 ac disturbed 1 Erosion and 1 Buffer 1
sediment 1 Swale 1
Industrial 1–3 ac disturbed 1 Erosion and 2 Buffer 1 or 2
sediment 1 Swale 1
Industrial 3 ac disturbed 2 Erosion and 4 Buffer 1 or 2
sediment 2 Swale 1 or 2
Created wetland 2 or 3
Wet pond 2 or 3
Conversion factor: ac acre; 1 acre 0.4046 ha 0.004046 km 2
Source: U.S. Environmental Protection Agency, Stormwater Best Management Practice Design Guide—Volume 1—General Considerations (2004).
Each matrix has two major components, which are broken down by land use type: an erosion
and sediment control level to achieve and a stormwater quality level to achieve. The level to achieve
for a given combination of land use and receiving-water category is a relative, qualitative measure
of the impact of storm runoff pollution. It ranges from 1 to 5, with 1 being the lowest impact and 5
being the greatest impact. For example, a multihousing development proposed for a priority estuary
watershed is given an erosion and sediment level to achieve a level 2 rating and a water quality level
to achieve a 3 rating. By comparison, a small residential development in the same priority water-
shed is given an erosion control level to achieve a level 1 rating and a water quality level to achieve
a 1 rating. In all cases, the levels to achieve for priority watersheds are greater than or equal to those
for nonpriority watersheds.
Each matrix also addresses the types of BMPs that can be implemented for pollution control.
ME DEP selected a number of BMPs and assigned each a treatment level code based on the ex-
pected level of pollutant removal. The treatment level code is a relative, qualitative measure de-
signed to indicate the relative pollutant removal expected from various BMPs. Treatment level
codes range from 1 to 3, with 1 providing the lowest level of control and 3 providing the greatest
level of control. The BMPs and their treatment level codes are shown in Table 12.11. As indicated,